

Regime Check
The regime just flipped. And not in a good way.
Four weeks ago, we launched with Reflation. Growth positive, inflation sticky, policy restrictive. Last week, we flagged Late Cycle concerns as liquidity deteriorated. This week? The dashboard is flashing Stagflation. The one regime nobody wants to see.
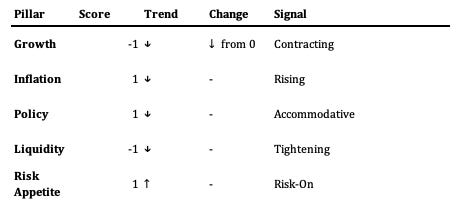
Current Regime: Stagflation
Weighted Score: 1.219 (down from 1.92) | Momentum: Weakening | Triggered Signposts: 3
How the Score Works:
Each pillar receives a raw score (-1/0/+1) based on indicator thresholds, then gets weighted: Growth 30%, Inflation 25%, Policy 20%, Liquidity 10%, Risk Appetite 15%. This week: Growth (-1 × 30% = -0.30) + Inflation (+1 × 25% = +0.25) + Policy (+1 × 20% = +0.20) + Liquidity (-1 × 10% = -0.10) + Risk Appetite (0.46 × 15% = +0.07) = 0.12 raw, which scales to 1.219 on the composite. The regime matrix plots Growth vs Inflation to determine quadrant; Policy, Liquidity, and Risk Appetite act as modifiers.
Recession Signposts Triggered Simultaneously
Here’s the thing: multiple signposts have triggered simultaneously.
Yield Curve Uninversion (2s10s at +67bps)
The 2s10s curve has uninverted to +67 basis points, historically a recession confirmation signal.
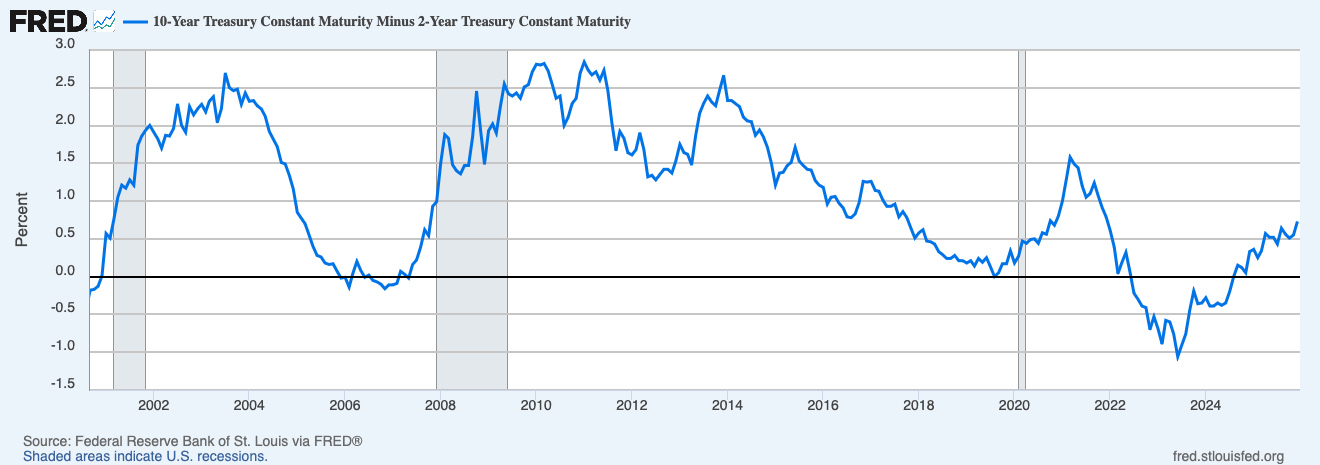
Source: https://fred.stlouisfed.org/series/T10Y2Y# (Recession Shading)
What curve uninversion means: The curve inverted in 2022-2023, signalling recession risk. Now it’s uninverted and pretty sharply too. The uninversion signal has preceded recessions in 7 of the last 8 cycles. Lag ranges from 2 months (2001) to 22 months (2007). We’re in that window, but timing precision is low.
Overnight RRP Exhausted ($0)
The overnight reverse repo facility has been completely drained.
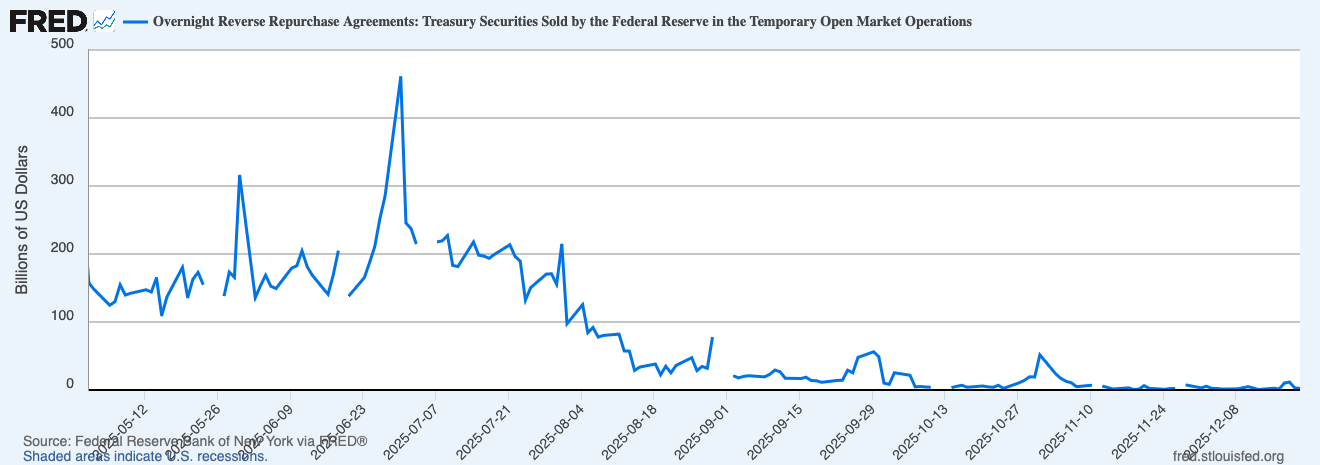
Source: https://fred.stlouisfed.org/series/RRPONTSYD#
Why this matters: RRP was the system’s shock absorber. Excess cash parked at the Fed provided a liquidity buffer. That buffer is now gone. Future funding stress will hit bank reserves directly. Relevance is conditional: matters if stress materializes.
VIX Below 15 (Complacency Signal)
The VIX is sitting below 15, pricing in a world where none of this matters.
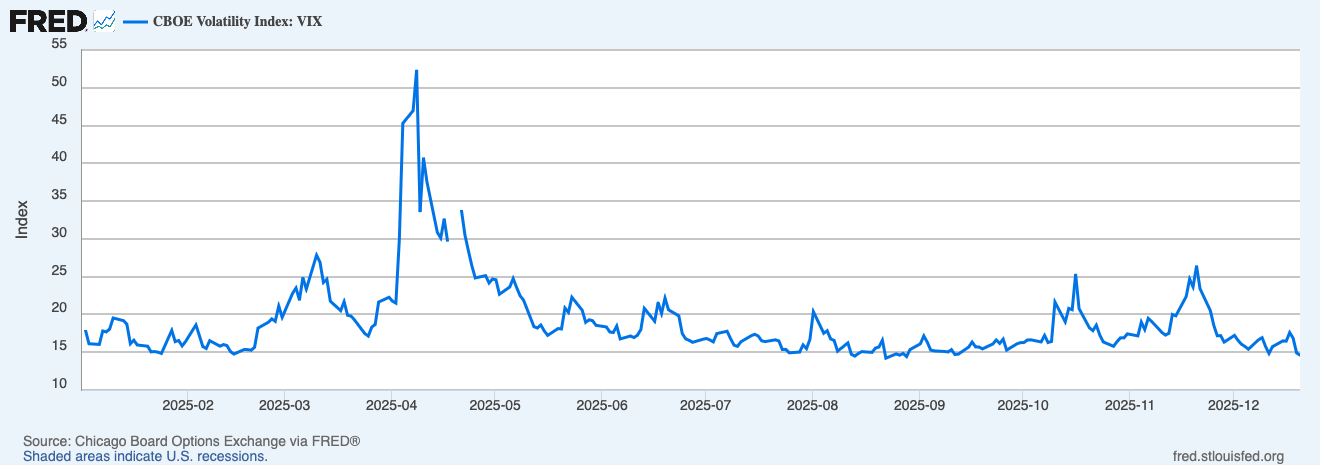
Source: https://fred.stlouisfed.org/series/VIXCLS#
The tension: VIX below 15 isn’t inherently wrong. Post-2010 average is ~17 with extended calm periods. But VIX below 15 while leading indicators flash warnings creates elevated spike risk. The last three instances of VIX <15 saw volatility double within 6 months. Low VIX means protection is cheap. That’s information worth noting.
Copper Gold Ratio at 0.0012: Fear Signal Explained
The copper/gold ratio (HG ÷ GC futures) hovering around 0.0012 is flashing fear and is currently sitting at its lowest level since November 1993.
What the ratio tells you: Copper = Industrial metal, growth-sensitive. Gold = Safe haven, fear trade, real rate play. Low ratio = Gold outperforming copper = Markets pricing fear over growth.
When copper/gold is this depressed, it’s telling you global growth expectations are weak. The ratio often leads equity weakness by 2-3 months historically.
Growth Pillar Breakdown: Why It Flipped Negative
The growth pillar just flipped negative. First time since we launched. This one matters.
ISM Manufacturing: 48.2 for the tenth consecutive month below 50. New orders minus inventories at 48.9 is the one bright spot, suggesting the contraction may be bottoming.
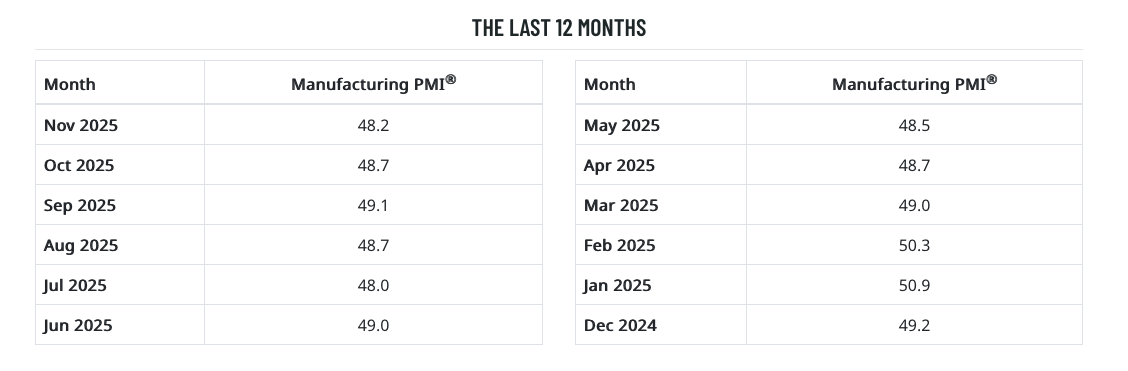
Source: https://www.ismworld.org/supply-management-news-and-reports/reports/ism-pmi-reports/pmi/november/
Initial Claims: Stable at 217,000 on the four-week average, historically low, but moving wrong direction from 208,300.
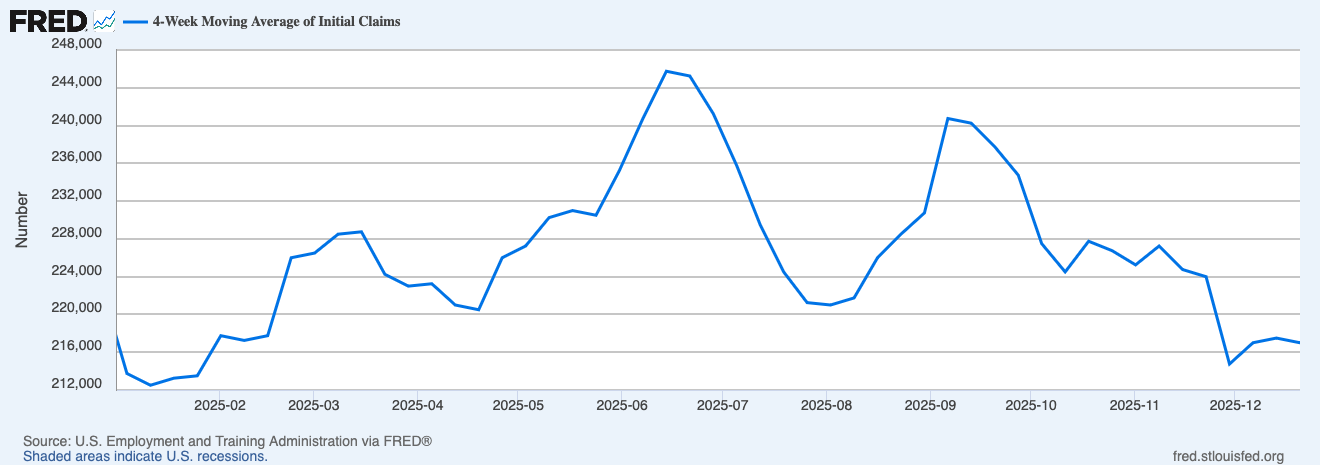
Source: https://fred.stlouisfed.org/series/IC4WSA#
Retail Sales: Decelerated to 3.3% year-over-year from 3.9% in September. The consumer isn’t cracking, but definitely slowing.
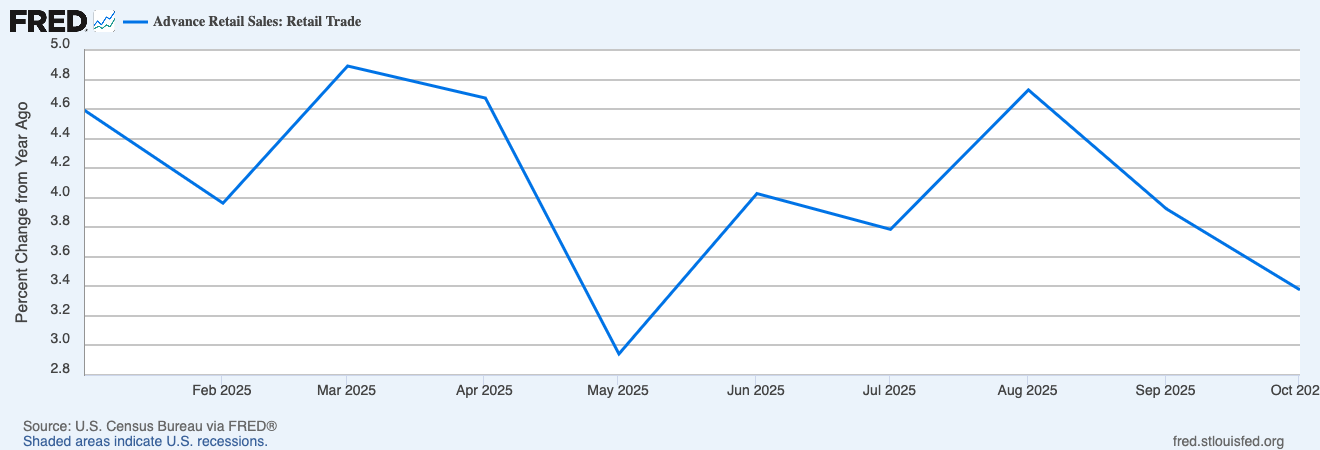
Source: https://fred.stlouisfed.org/series/RSXFS#
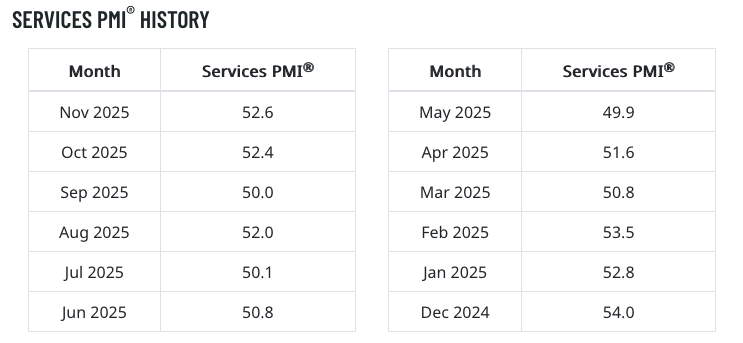
ISM Services: 52.6 is the saving grace. Services represent ~70% of the economy and are still expanding, but barely.
Atlanta Fed GDPNow: 3.5% seems to contradict the growth downgrade. But GDPNow is backward-looking. The regime framework weights leading indicators to identify where we’re heading.
Growth Score: -1 (Contractionary) | This is the most significant regime shift since we started publishing.
Core PCE vs Core CPI: Limited Visibility
Not much new to work with here. The government shutdown wiped out key data, and the prints we do have are stale. Core PCE sits around 2.8%, Core CPI around 3.3% - both unchanged from prior readings in any meaningful way.
The divergence between the two measures persists, but without fresh data it’s hard to know whether that gap is narrowing or widening. The Fed watches PCE; markets watch CPI. Right now, neither is telling us anything we didn’t already know.
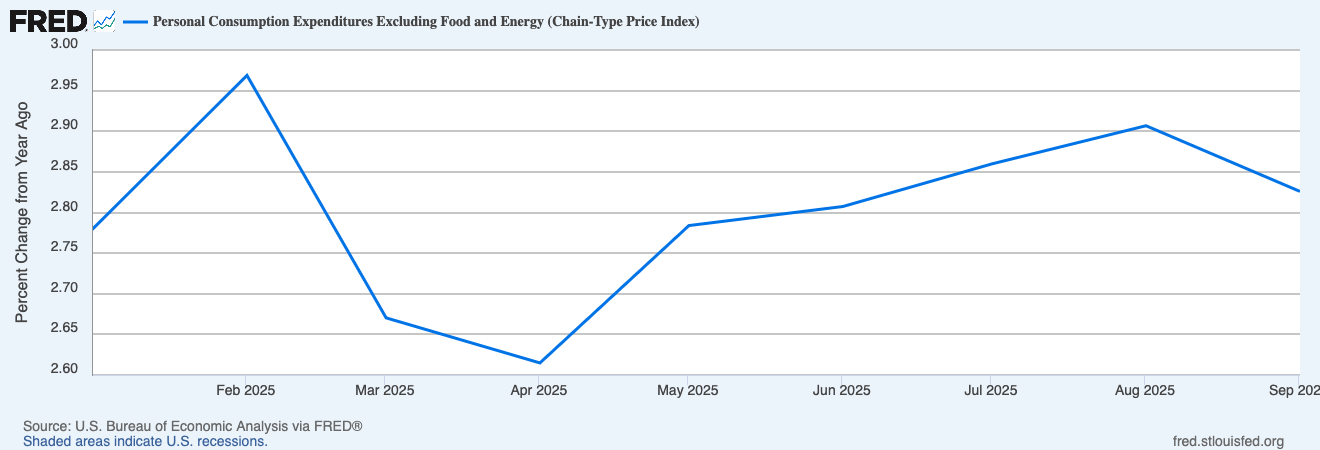
Source: https://fred.stlouisfed.org/series/PCEPILFE#
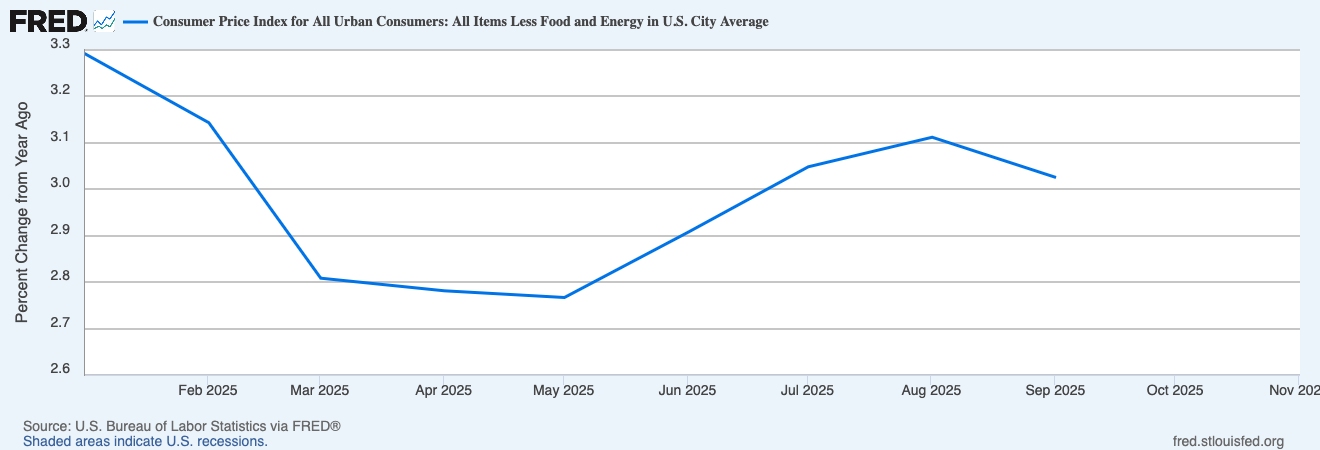
Source: https://fred.stlouisfed.org/series/CPILFESL
Cross-Asset Implications for Stagflation Regime
Stagflation changes everything. Growth negative, inflation positive, liquidity tight, this is the toughest configuration historically.
Cross-Asset Implications for Stagflation Regime
Stagflation changes everything. Growth negative, inflation positive, liquidity tight, this is the toughest configuration historically.
Gold
Gold is the classic Stagflation beneficiary historically. Inflation elevated, real rates potentially falling as Fed is forced to ease, uncertainty rising. GLD inflows were positive this week while most everything else saw outflows. The structural case: central bank buying, reserve diversification. The tactical observation: regime uncertainty.
Cyclical Assets
Stagflation is historically the worst regime for equities. Growth slowing while input costs remain elevated compresses margins. Small caps and cyclicals historically face the toughest backdrop when liquidity is tightening and growth is negative.
Defensives
Utilities and staples historically provide relative stability in Stagflation. Companies with pricing power, stable cash flows, and dividend support tend to hold up better.
Dollar
Stagflation is historically dollar-positive. When global growth weakens and uncertainty rises, capital tends to flow to the reserve currency.
Regime Signposts: What Would Change the View
Growth stabilizes: ISM Manufacturing above 50 or ISM Services above 54 flips growth back to neutral. Moves from Stagflation toward Reflation.
Inflation breaks lower: Core PCE at 2.5% or below shifts inflation to neutral. Stagflation becomes Disinflation, historically constructive.
Credit cracks: HY spreads above 400bps confirms recession signal. Currently 290bps.
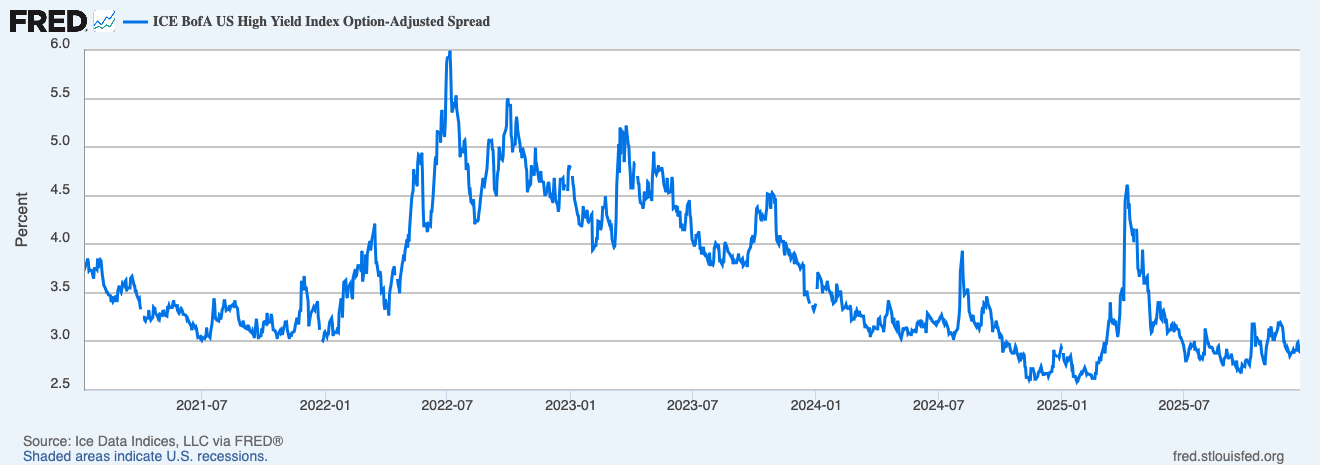
Source: https://fred.stlouisfed.org/series/BAMLH0A0HYM2#
VIX spikes above 25: Complacency signpost clears. Paradoxically, that historically makes setups more interesting as elevated fear tends to precede better opportunities.
VIX spikes above 25: Complacency signpost clears. Paradoxically, that historically makes setups more interesting—elevated fear tends to precede better opportunities.
The Bottom Line
Current Regime: Stagflation | Growth negative, inflation elevated, multiple signposts triggered.
The regime historically favors defensives and gold over cyclicals. Risk reduction makes sense when signposts trigger simultaneously.
VIX below 15 creates elevated spike risk. Protection is cheap.
Frameworks have limitations. The bull case, services are holding, CPI improving, AI/fiscal tailwinds, credit calm, is legitimate. Markets could be right and indicators wrong.
What’s to Come in 2026
While I’m away from screens, the framework isn’t standing still. Honestly, I’m more excited about this than the holidays. Here’s what’s cooking:
Dashboard Overhaul. The current regime dashboard has served us well, but it’s version 1.0—held together with duct tape and good intentions. Over the holidays, I’m rebuilding it from the ground up. Additional data points across all five pillars, refined indicator selection, cleaner automation. The goal is simple: more signal, less noise.
Lead/Lag Weightings. Here’s the thing: not all indicators are created equal. Some lead the cycle by months, others just confirm what’s already happened. The upgraded framework will weight leading indicators more heavily in the composite scores, helping us spot regime transitions before they show up in the lagging data. The LEI triggering this week is exactly the kind of signal that should carry more weight than coincident indicators showing strength.
Refined Regime Scoring. The current system works, but it can be sharper. I’m implementing buffer zones to prevent whipsaw signals (nothing worse than flipping regimes twice in a week), momentum tracking to assess whether trends are strengthening or weakening, and transition probability calculations. The aim is catching the move from Goldilocks to Stagflation before it’s obvious—not a week after everyone else has noticed.
The Debrief Launches. Starting in January, we’re adding a fourth content stream: The Debrief. Monthly review of what worked, what didn’t, standout ideas and themes, and any dashboard iterations for performance improvement. It’s accountability in public—tracking positioning ideas, acknowledging mistakes, refining the framework to reduce false signals. If I’m going to ask you to trust the regime framework, you deserve to see the receipts.
The first Debrief drops early February, covering December and January’s journey from Goldilocks optimism to Stagflation warning. Should make for interesting reading, there’s plenty to review already.
Happy holidays. I’ll see you January 5th with a refreshed dashboard and a new year of regimes to navigate. Can’t wait.
Questions or feedback? Drop me a line at macroanalytix.research@gmail.com.
Disclaimer
All content published by MacroAnalytix is for research and educational purposes only. Nothing on this site or in our publications should be interpreted as financial advice, investment recommendations, or a solicitation to buy or sell securities.
You are solely responsible for your own financial decisions. Please conduct your own due diligence and consult with a licensed financial professional before making any investment or decisions.