

We’ve spent weeks in Neutral/Chop. Four pillars at zero. Only Risk Appetite positive. The framework didn’t see a directional catalyst, so we didn’t pretend to have one. We said the signposts would tell us before the headlines did.
On Saturday, the US and Israel launched joint strikes against Iran. Iran’s supreme leader has been confirmed killed. Iran has retaliated with strikes across the region. The Strait of Hormuz (through which roughly 20% of the world’s daily oil supply passes) has been effectively closed to shipping. Markets were already closed for the weekend.
That’s the headline. This publication isn’t going to become geopolitical commentary, you can get that everywhere else. What we’re going to do is what we always do: run it through the framework, assess both paths and let the pillars tell us what the regime is becoming.
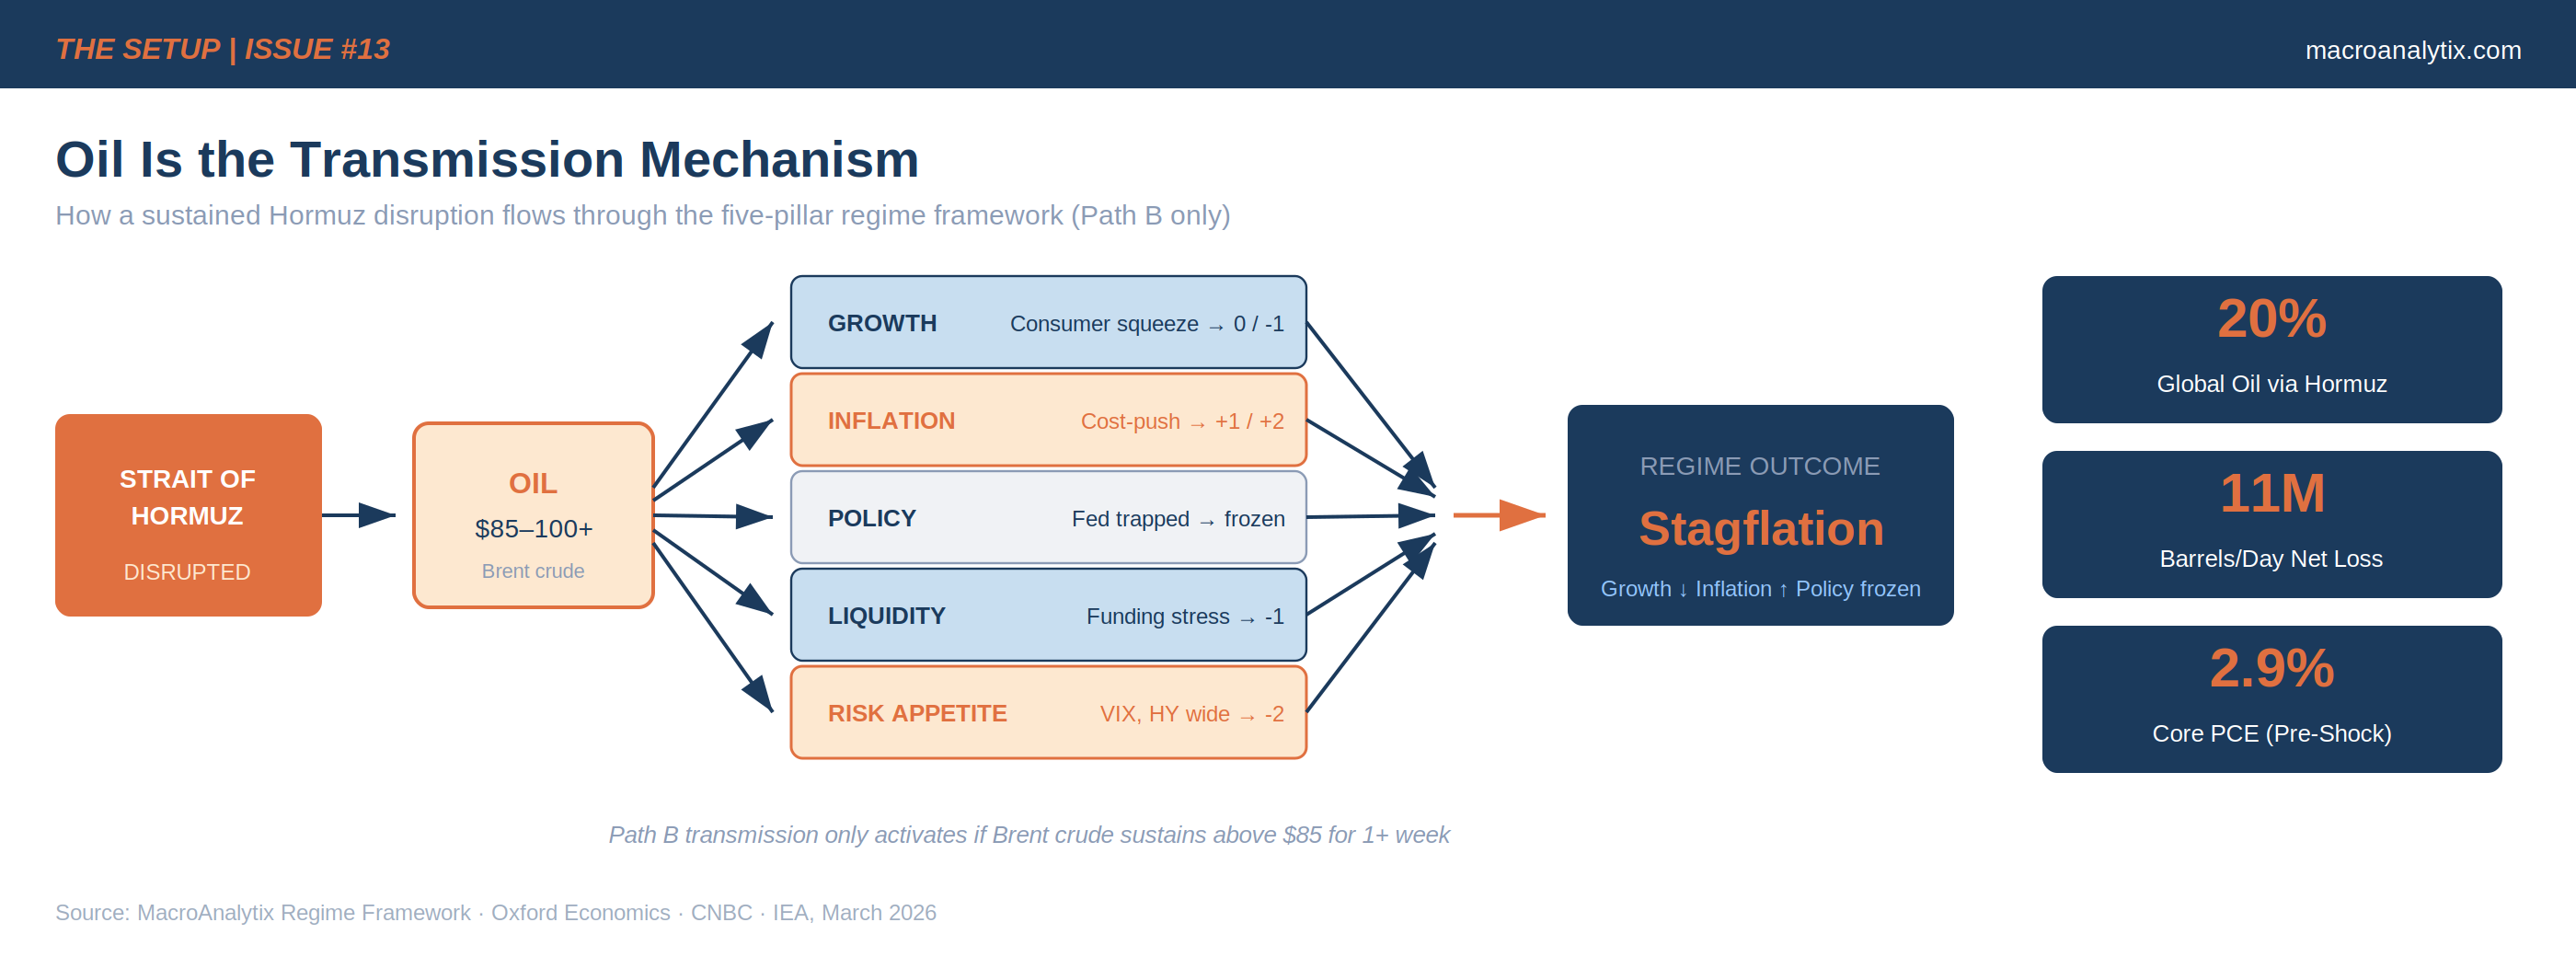
The single variable that matters for the regime framework is oil. Not the politics, not the military outcomes, not the diplomacy. Oil is the transmission mechanism through which this event reaches Growth, Inflation, Policy, Liquidity and Risk Appetite. Everything else is downstream.
And the question is simple: how long?
Where We Were Coming In
Before this weekend, the dashboard was already giving us a complicated read. Here’s the backdrop:
Growth: 0, uncertain. ISM Manufacturing surprised at 52.6 in January, the first expansion in 12 months. But Q4 GDP came in at just 1.4%, well below consensus. The two-speed economy (manufacturing recovering, GDP weak) was unresolved. Monday’s ISM Manufacturing for February was already the most important print of the week.
Inflation: 0/+1, trending up. Core PCE at 2.9% with a hot 0.4% monthly print. The inflation pipeline was no longer clearing, it was arguably refilling. The disinflation narrative was losing conviction.
Policy: 0, maximum uncertainty. The SCOTUS IEEPA ruling invalidated ~60% of the tariff architecture. Trump pivoted to Section 122 with a 15% global tariff. The Fed remained on hold with first cuts not priced until July. Policy was frozen.
Liquidity: 0, neutral. No material plumbing stress but financial conditions tightening via uncertainty.
Risk Appetite: 0/-1, deteriorating. VIX at 19.86. Gold futures above $5,200. BTC falling to $66,400. The one pillar that had been positive for months was rolling over.
Regime: Neutral/Chop for the twelfth consecutive week. We flagged in Issue #012 that the path to Late Cycle was shorter than the path to Goldilocks, but neither had enough momentum. We were waiting for a catalyst.
Two Paths: Framework Implications
Geopolitical shocks are binary for markets. They either resolve quickly and become a footnote or they persist and rewire the macro landscape. The June 2025 12-day conflict is the relevant precedent, oil spiked, then retraced. The Strait of Hormuz stayed open. Markets absorbed the shock within weeks.
This time could follow the same pattern. It could also be structurally different. The framework doesn’t require us to know, it requires us to map both paths and let the data tell us which one is unfolding.
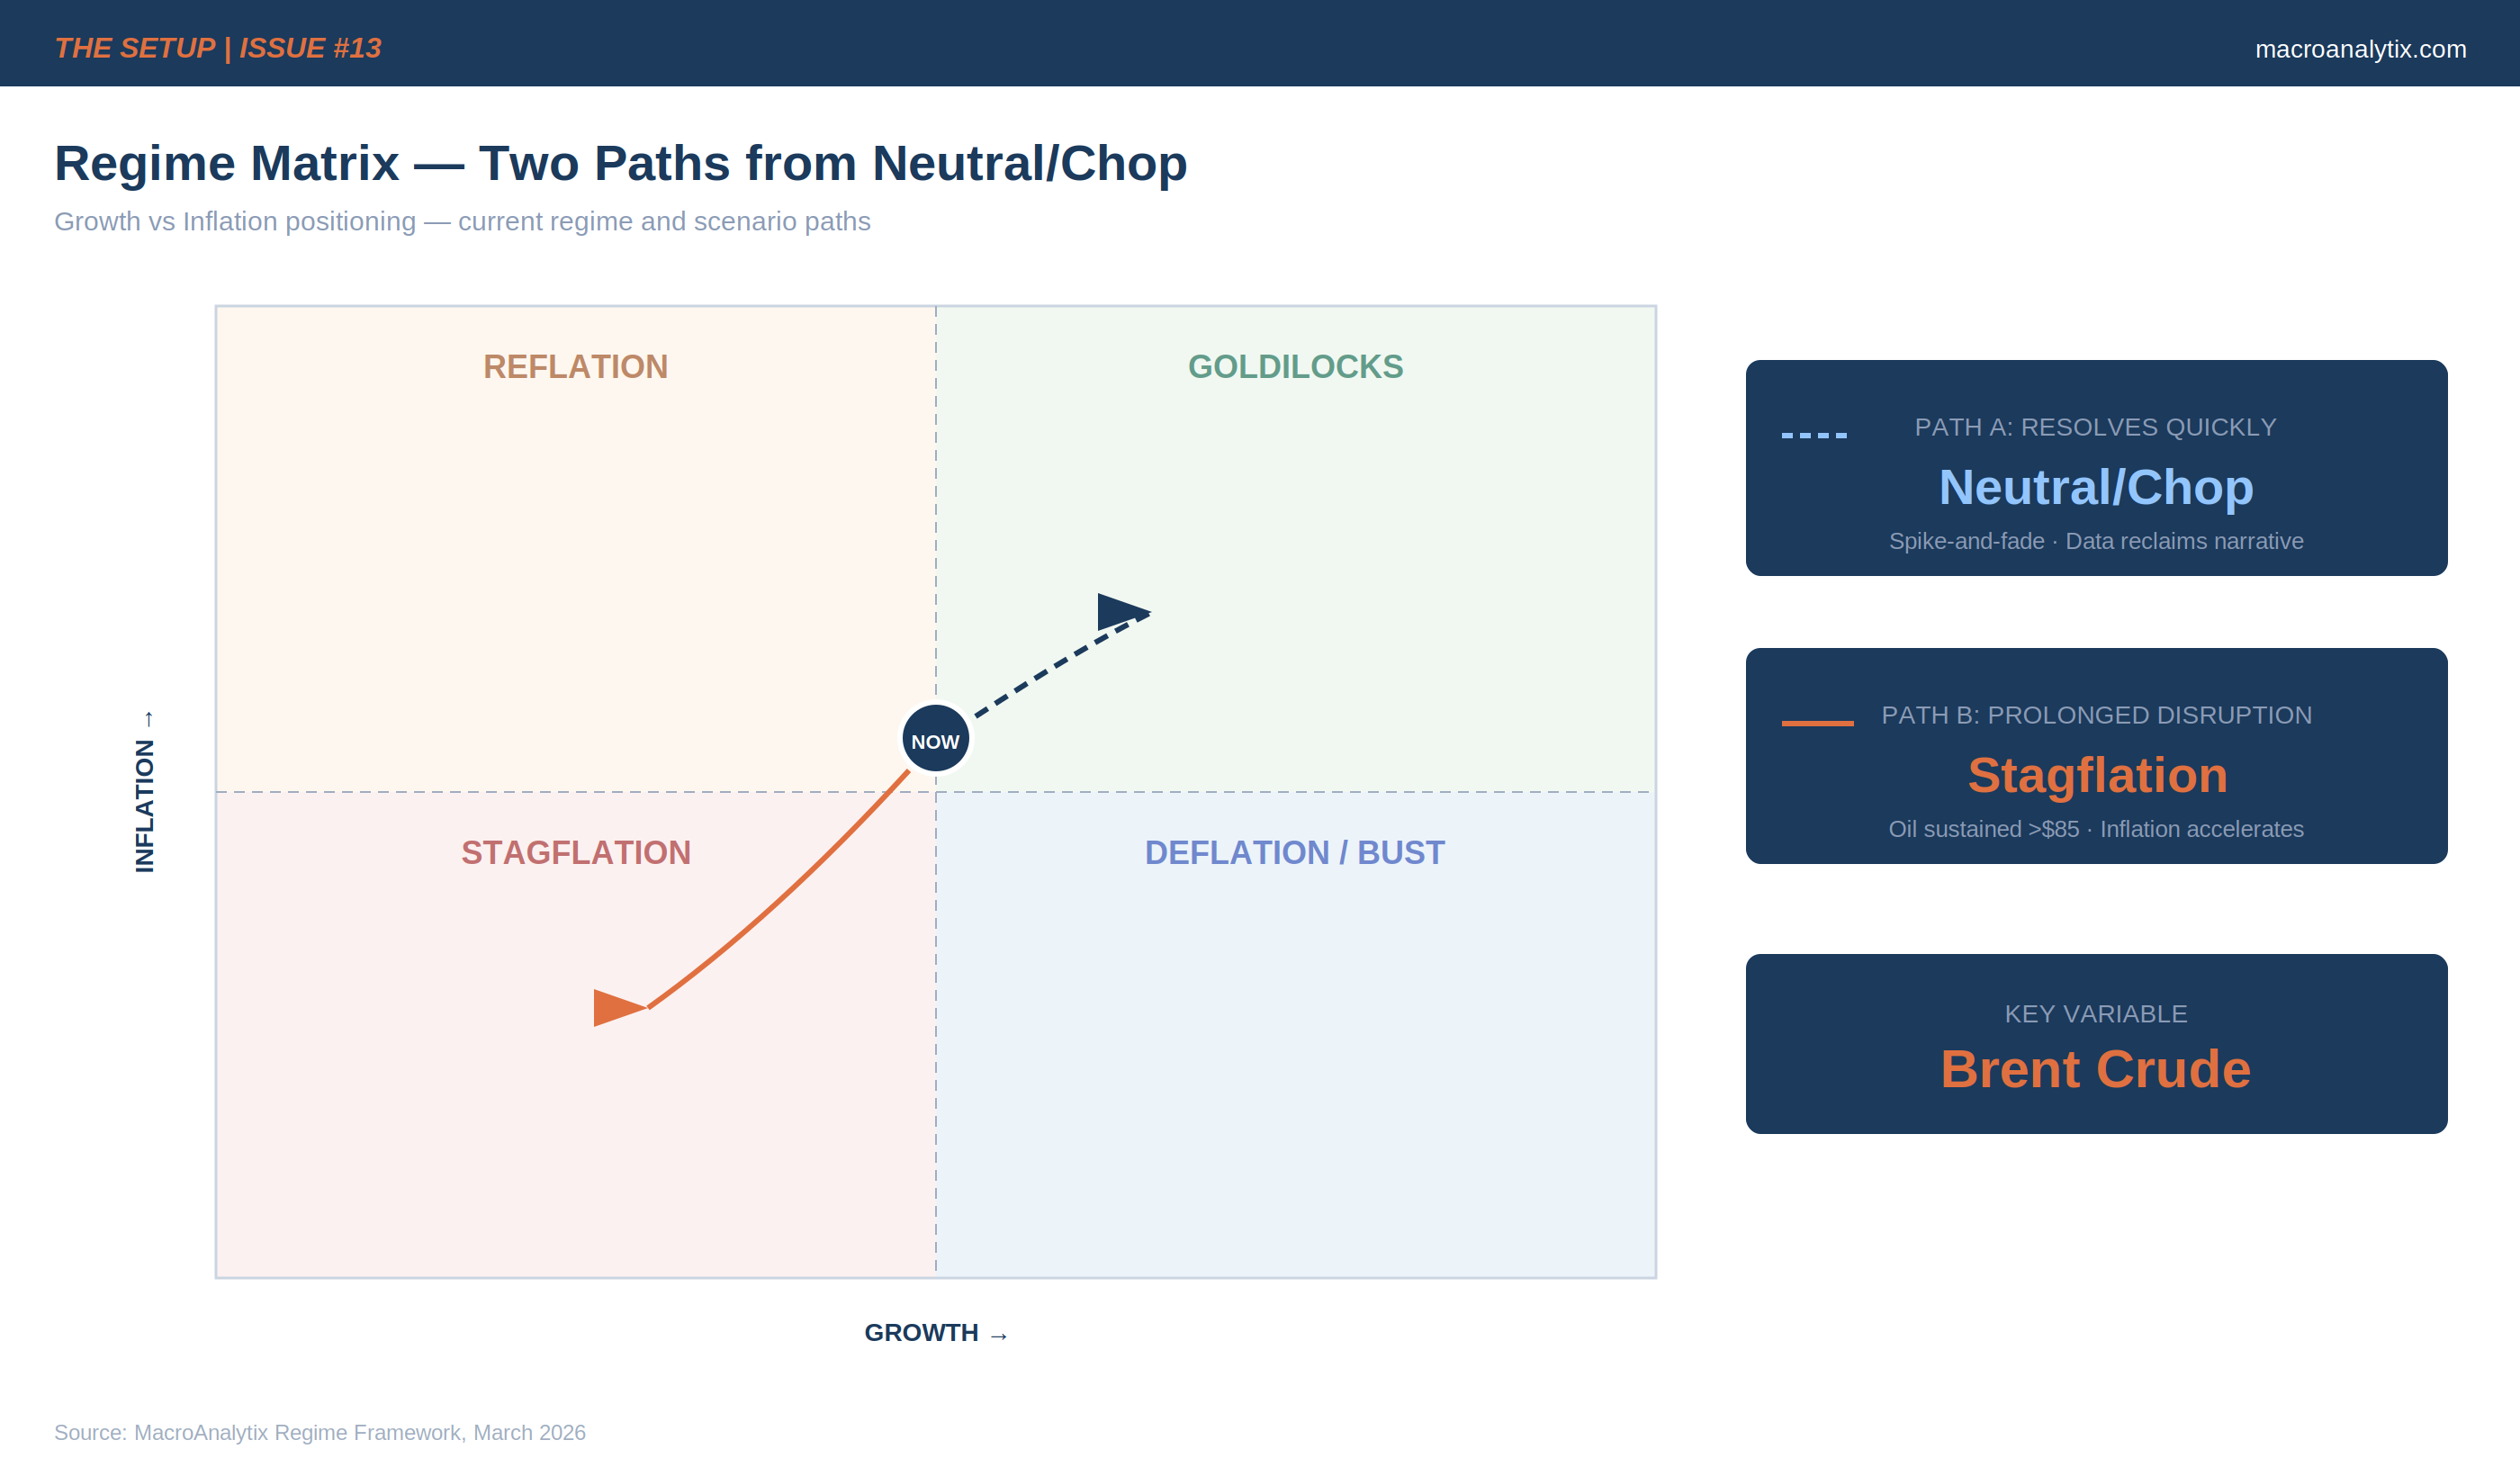
Path A: Resolves Quickly
The scenario: Strikes conclude within days. Hormuz reopens. Oil spikes to $80-85 then retraces toward $70-75 within two weeks. The conflict follows the June 2025 pattern, intense but brief with limited lasting economic impact.
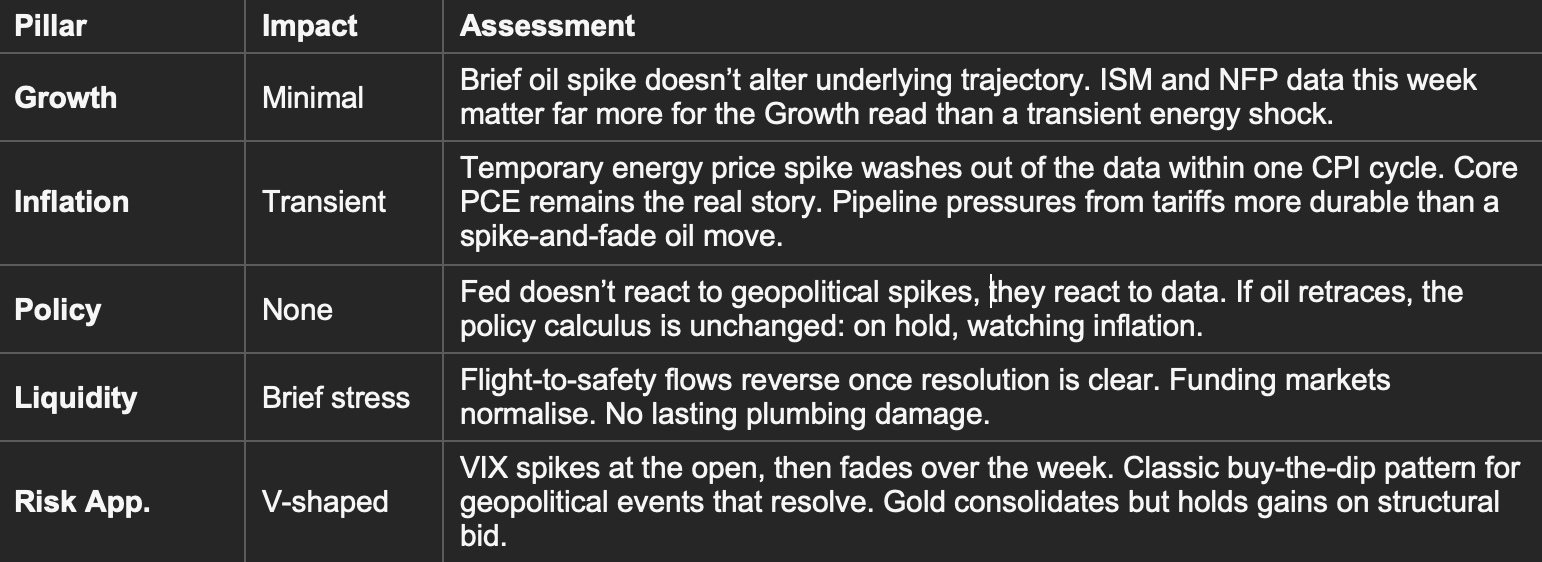
Regime outcome: Back to Neutral/Chop within 2-3 weeks. The data (ISM, NFP, CPI) reasserts dominance over the narrative. The week’s economic releases become the more important story. The regime question reverts to: can manufacturing sustain expansion while inflation stays sticky?
Path B: Prolonged Disruption
The scenario: Conflict extends beyond this week. Hormuz stays disrupted for days or weeks. Oil sustains above $85, potentially moving toward $100. Energy cost pass-through begins flowing into the real economy.
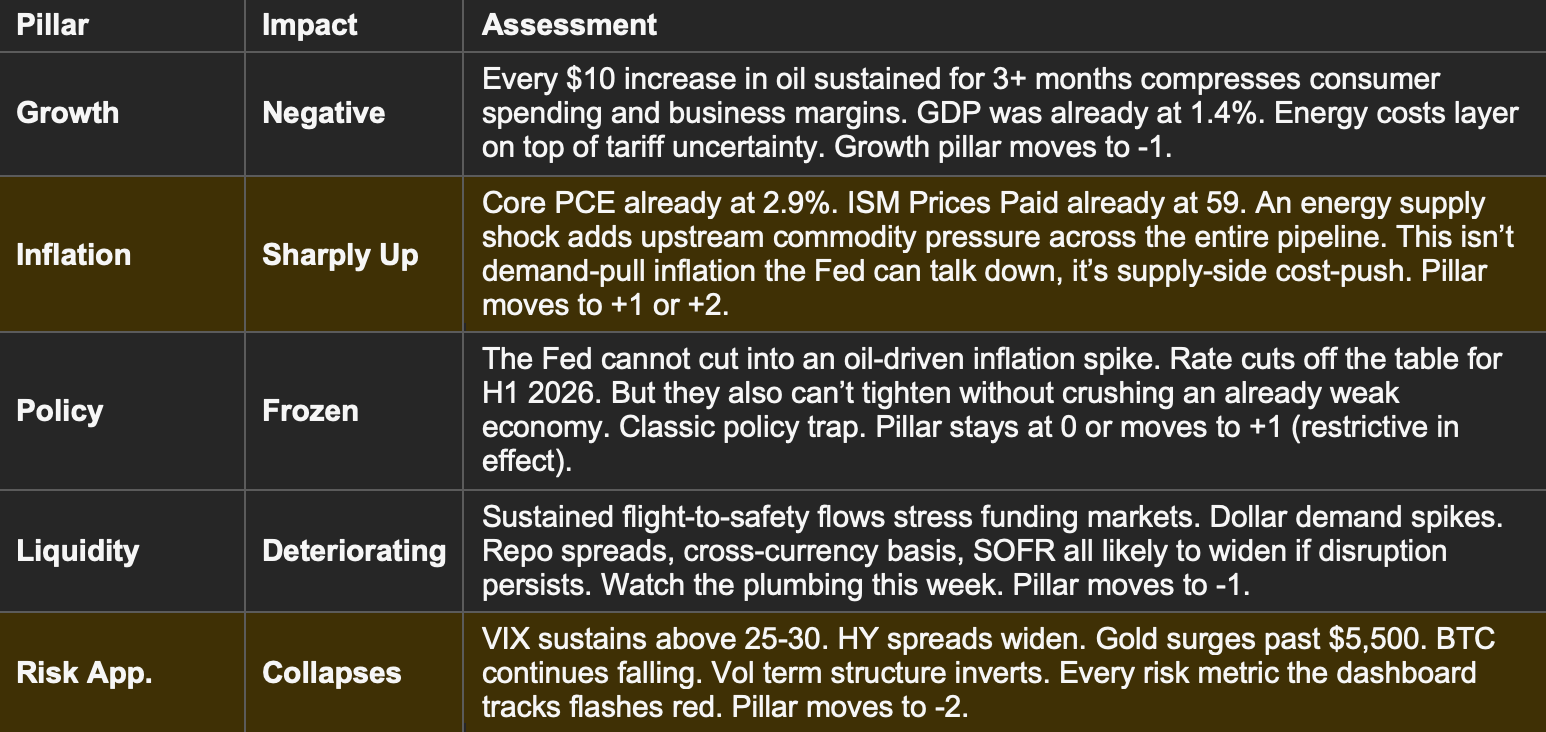
Regime outcome: Stagflation. Growth flat-to-negative. Inflation sharply positive. Policy frozen. The same regime we identified during the Issue #004 scare, except that time the catalyst was data-driven and self-correcting. An oil supply shock is self-reinforcing: higher energy costs weaken growth and push inflation higher simultaneously. That’s the textbook definition of a stagflationary impulse.
What Tells Us Which Path We’re On
We don’t need to predict the geopolitical outcome. The market will tell us. Here are the signposts:
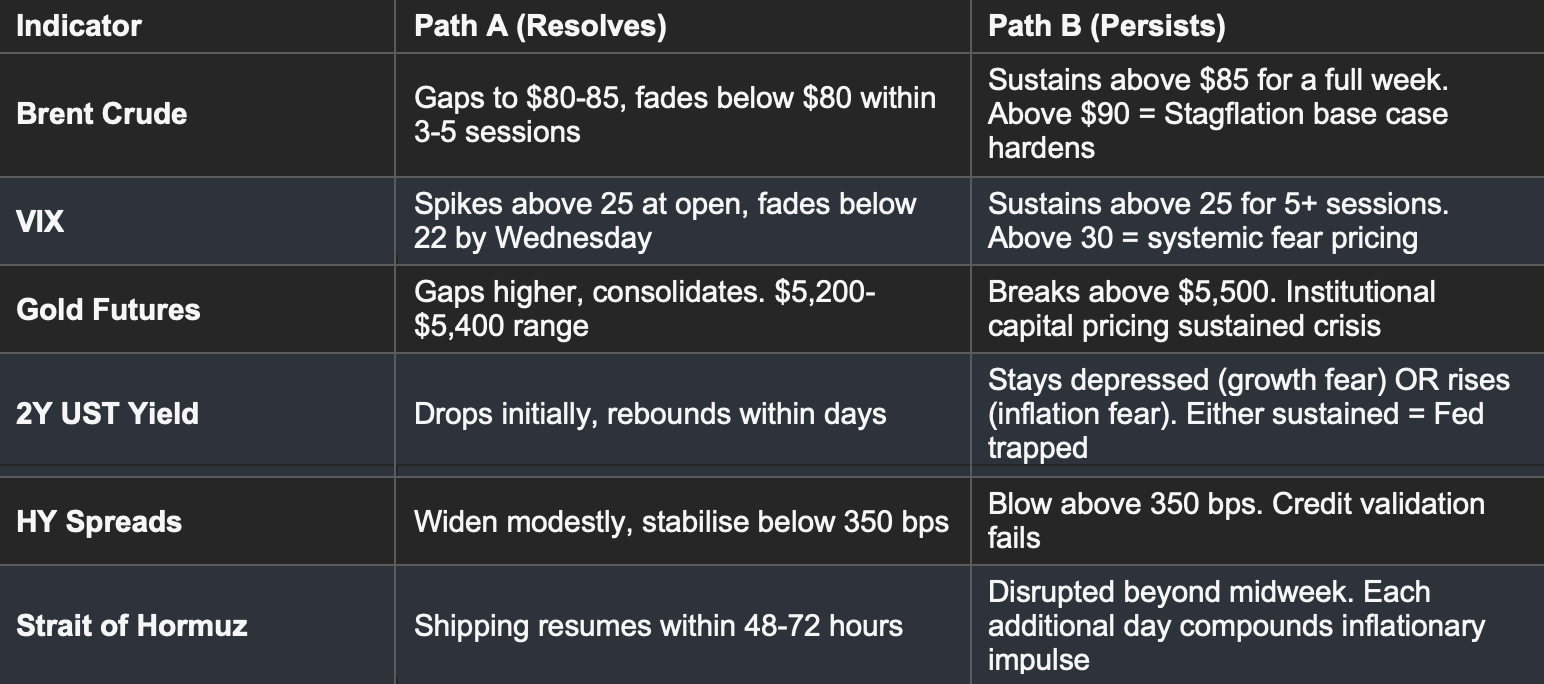
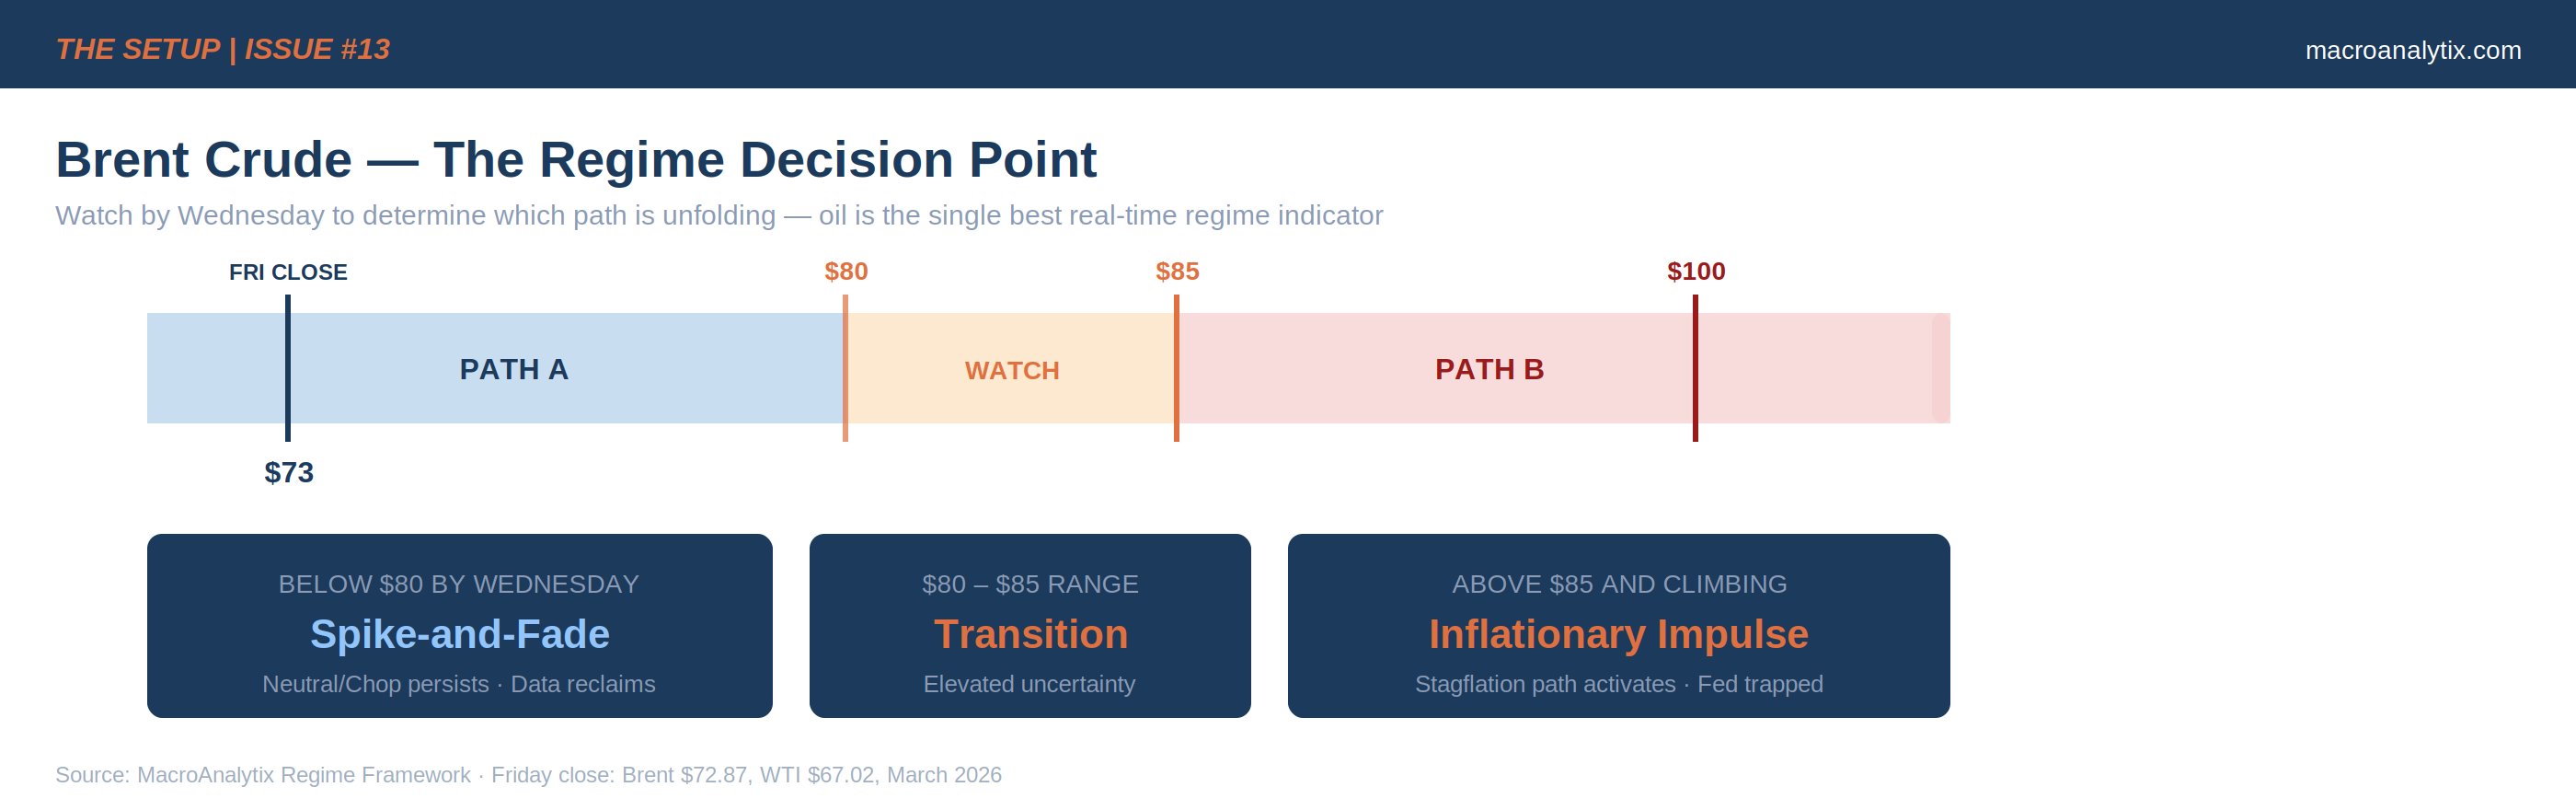
The hierarchy is clear: watch oil first, then VIX, then credit. If Brent is below $80 by Wednesday and the VIX is fading, this is Path A and the economic data reclaims the narrative. If Brent is above $85 and climbing, the data is secondary. The oil shock is the story and the regime is shifting.
The Week Ahead: Data Still Matters
Regardless of which path unfolds, this week’s economic data was already critical. These releases now serve a dual purpose: they tell us the pre-shock state of the economy, which determines how much resilience exists to absorb an oil hit.
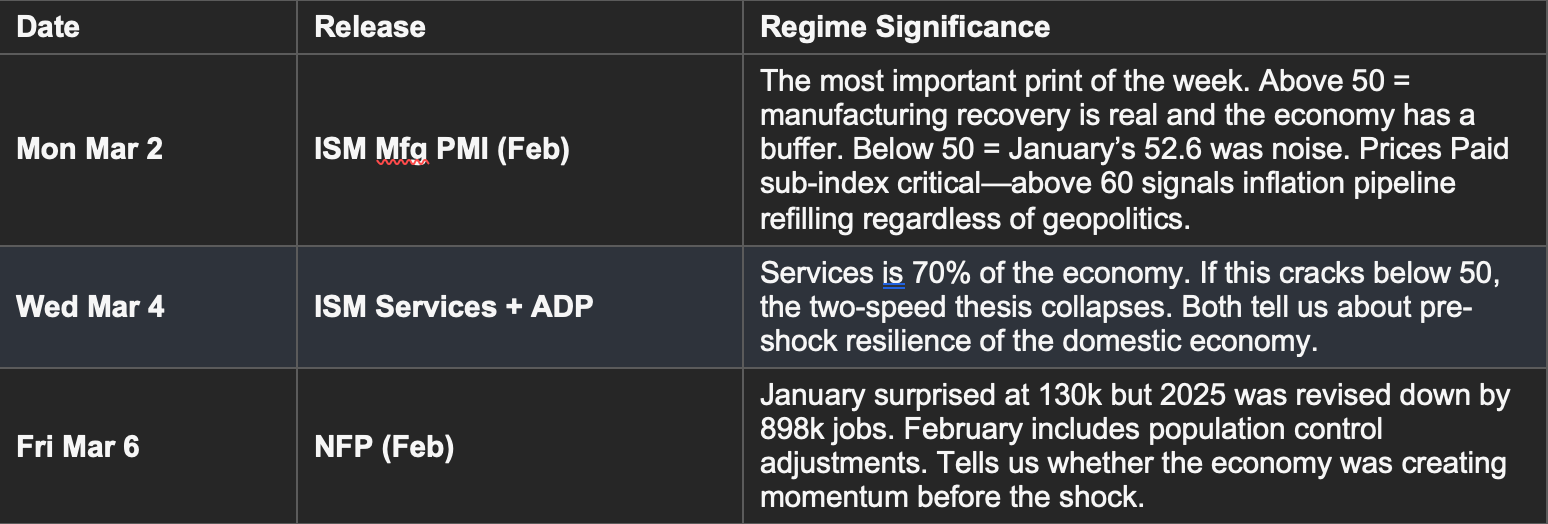
Note: the ISM survey period likely captured pre-strike sentiment since the conflict began on Saturday. It won’t directly reflect the geopolitical shock, which makes it a cleaner read of underlying economic trajectory.
Cross-Asset Positioning Framework
I’m not going to prescribe trades into a gap. What I will do is map the framework’s logic for each path so you know where each asset class sits before the open.
Oil & Energy
WTI closed at $67. Brent at $73. Both will gap higher at the open. The magnitude tells you which path the market is pricing. Path A: spike to $80-85, then retrace. Energy names gap up, give some back. Path B: sustained above $85-100. Energy becomes the only sector with a structural bid.
Gold
Already above $5,200 before this weekend. Every structural driver (central bank buying, dollar weakness, reserve diversification) was already in place. A geopolitical shock adds flight-to-safety demand on top. Gold works in both paths. Path A: consolidates at elevated levels. Path B: breaks higher toward $5,500+. The only scenario where gold falls meaningfully is a clean, immediate resolution, the lowest probability outcome.
Equities
S&P at 6,889 will gap lower. Path A: classic buy-the-dip, geopolitical shocks that resolve quickly have historically been poor selling opportunities. Path B: sector rotation is violent. Defence and energy outperform. Consumer discretionary, airlines, travel underperform. Small caps (RTY at 2,632) most vulnerable given tight margins and domestic demand sensitivity.
Bonds & Rates
10Y at 3.97% faces competing forces: flight-to-safety (lower) vs inflation expectations (higher). Path A: initial safety bid, yields drift back toward pre-shock levels. Path B: the 2-year is the key indicator. Watch 2s10s, steepening confirms Late Cycle/Stagflation.
FX & Dollar
DXY at 97.6, already below the 100 signpost. Path A: brief safe-haven dollar bid, then resumes drift lower. Path B: USD/JPY is the detonator. If yen strengthens violently (below 150), carry positions unwind globally, a liquidity event layered on a geopolitical event.
Crypto
BTC at $66,400 was already sliding. Path A: stabilises once risk premium fades, doesn’t lead the recovery. Path B: further downside. The “digital gold” narrative doesn’t survive contact with an actual geopolitical crisis, real gold does that job.
The Bottom Line
Weeks of Neutral/Chop. The signposts were accumulating, but nothing had enough momentum to break the regime.
Now there’s a catalyst. Whether it matters depends entirely on duration.
If this resolves in days: it’s a spike-and-fade. The data this week reclaims the narrative. Neutral/Chop persists with elevated volatility.
If oil spikes and holds past midweek: the inflation transmission mechanism activates. Cost-push inflation layers on top of already-sticky Core PCE. The Fed can’t cut. Growth deteriorates. That’s Stagflation, the regime the framework has flagged as the shortest path since Issue #005.
Practical framework for the week:
1. Watch oil, not headlines. Brent is the single best real-time indicator of which path is unfolding. Spike and fade by Wednesday = Path A. Higher and climbing = Path B.
2. Don’t sell the gap. The worst prices in a geopolitical shock are usually the opening prices. If you didn’t reduce exposure before, selling Monday’s open gives the market the worst of you.
3. Gold is the hedge that works both ways. It consolidates in Path A, breaks higher in Path B.
4. ISM Manufacturing is still the most important number tomorrow. It tells us the pre-shock state of the economy. A strong print means resilience. A weak print means we were already fragile.
5. Define your levels before the open. Know what level changes your view. Know what level triggers your risk reduction. Know what you own and why you own it if this is Stagflation.
The framework exists for exactly this moment, to provide structure when the world feels structureless. It’s not telling us to panic. It’s telling us: oil is the variable, duration is the question and the answer comes from the market, not from us.
I’ll publish a Pulse mid-week once markets have generated real prices and the dashboard can produce confirmed scores. If something material shifts before then, you’ll hear from me sooner.
Questions or feedback? Drop me a line at macroanalytix.research@gmail.com
Disclaimer
All content published by MacroAnalytix is for research and educational purposes only. Nothing in this publication constitutes financial advice, investment recommendations, or solicitation to buy or sell any securities. The regime framework and cross-asset analysis represent the author’s interpretation of publicly available data and should not be relied upon as the sole basis for investment decisions. Past performance of the framework or any referenced positioning ideas does not guarantee future results. Always consult a qualified financial advisor before making investment decisions.