

Regime Check: Zooming Out
It’s easy to get lost in the week-to-week.
Every Sunday for twelve weeks, I’ve sat down with the dashboard, scored the pillars, tracked the signposts and tried to separate signal from noise. Some weeks the story was obvious. Most weeks it wasn’t. Somewhere between the ISM prints and the NFP revisions and the carry unwind warnings, I realised something: the weekly cadence, while essential, can obscure the bigger picture.
So this week we’re doing something different. Instead of zooming into the latest data point, we’re zooming out. Mapping the trajectory. Where has the economy actually been, where is it now and based on twelve weeks of regime data where is it likely heading?
The headline hasn’t changed. We’re still in Neutral/Chop with a Tailwind modifier and minimal conviction. Aggregate score sits at +1. All four validation checks pass. Same three signposts triggered. If you’ve been reading since January, that probably sounds familiar.
But the trajectory underneath tells a story the weekly snapshots can miss.
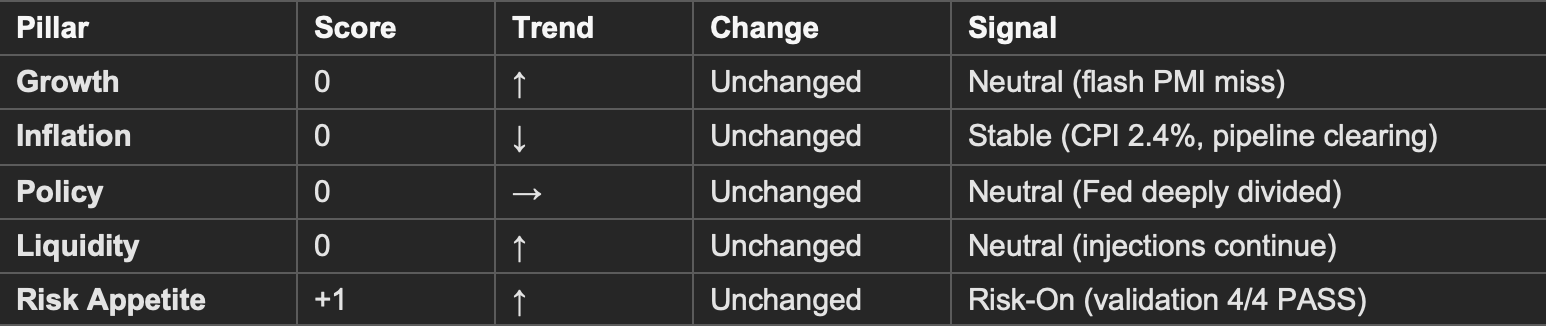
Current Regime: Neutral/Chop | Aggregate Score: +1 | Modifier: Tailwind | Conviction: Minimal
Sources: MacroAnalytix Dashboard | TradingView: https://www.tradingview.com | BLS: https://www.bls.gov
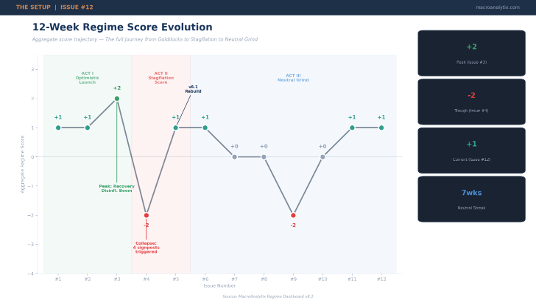
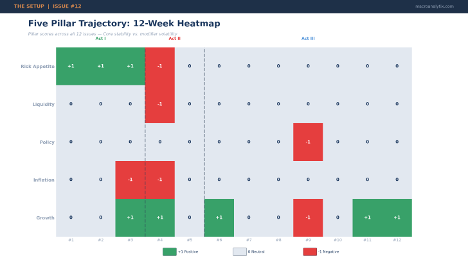
The 12-Week Journey: A Regime in Three Acts
Here’s the full arc mapped in one place:
Three acts emerge from the data.
Each tells us something different about where we’re heading.
Act I: The Optimistic Launch (Issues #001 - 003)
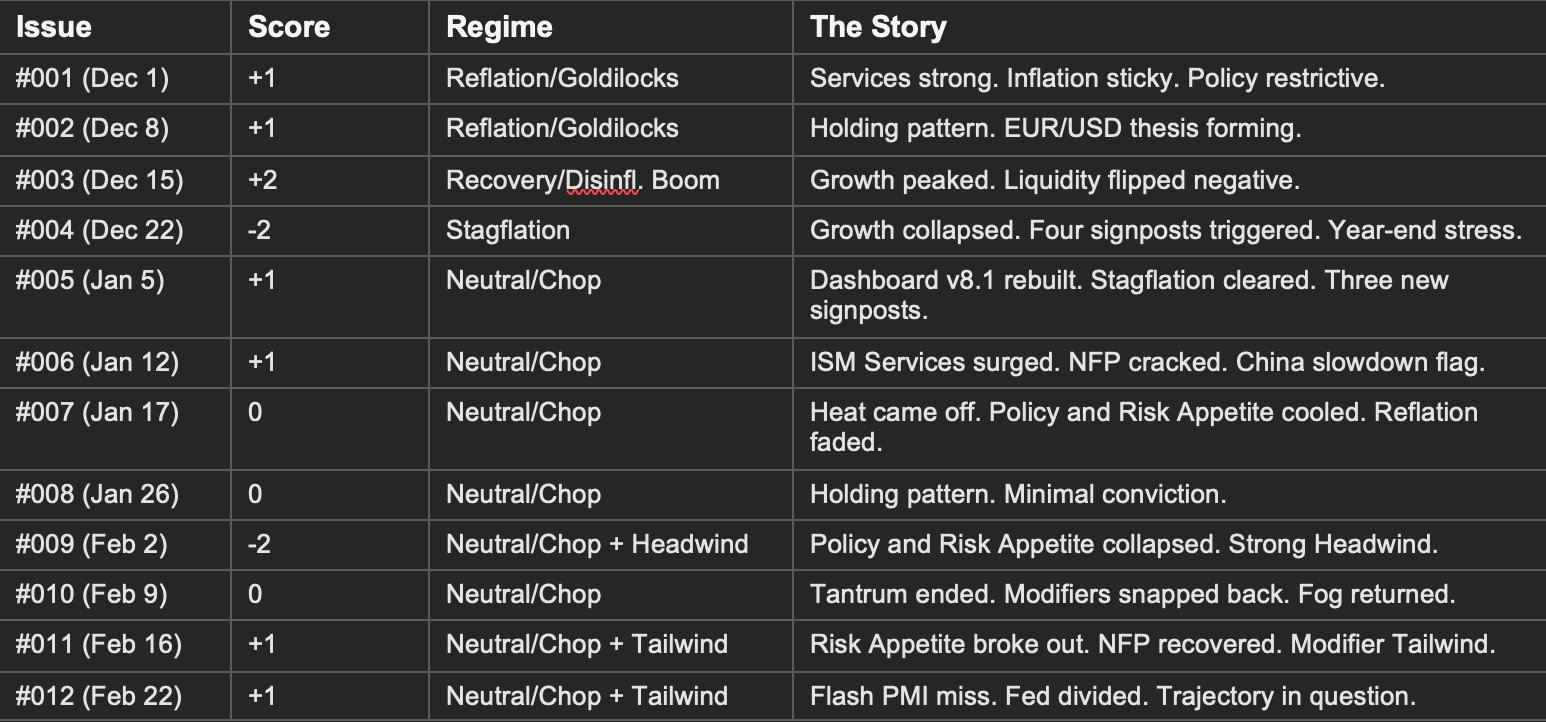
We launched in December with services booming, growth expanding, and the post-election reflation trade in full swing. ISM Services surged to 54.4 in December 2025, the highest reading of the year. GDP was tracking above trend. The dashboard scored it Reflation/Goldilocks, the best environment for risk assets.
The aggregate peaked at +2 in Issue #003 as growth hit its highest score and the framework briefly classified the regime as Recovery/Disinflationary Boom. That was the high-water mark. Looking back, the optimism was warranted by the data but the conditions were already more fragile than they appeared. Liquidity had quietly flipped negative. The plumbing stress that would define the December selloff was already building beneath the surface.
Lesson learned: peak regime scores often coincide with peak fragility. When everything looks good, that’s precisely when the framework should be watched most closely for deterioration.
Act II: The Stagflation Scare and Reset (Issues #004 - 005)
Issue #004 was the moment the framework proved its worth. The aggregate collapsed from +2 to -2 in a single week. Growth turned negative. Liquidity went deeply negative. Four signposts triggered simultaneously. The dashboard classified it Stagflation (the worst quadrant) right as markets were pricing peak optimism.
Was it real? Partially. Year-end funding stress, PCE overshooting expectations and ISM Manufacturing hitting its lowest since October 2025 were genuine deteriorations. But the framework was also reacting to seasonal plumbing stress and a binary PCE print that looked worse in isolation than in context.
The holiday rebuild Dashboard v2 was born from this experience. Buffer zones to prevent whipsaws. Leading versus coincident indicator weighting. The inflation pipeline model. Every improvement was a direct response to watching the framework react too aggressively to what turned out to be largely transient stress.
Lesson learned: frameworks need buffers. Binary scoring without zones produces dramatic headlines but noisy signals. The v2 upgrade has been validated by every subsequent issue, the regime hasn’t whipsawed since.
Act III: The Neutral Grind (Issues #006 - 012)
Seven consecutive weeks in Neutral/Chop. That’s not a coincidence, it’s the regime telling us something. The economy isn’t breaking. It isn’t booming. It’s grinding.
Within that grind, the modifiers have told a volatile story. Risk Appetite surged to +1, collapsed to -1 and surged back to +1. Policy went from accommodative to restrictive and back to neutral. The core pillars (Growth, Inflation, Liquidity) sat at zero the entire time. The engine never changed. Only the road conditions did.
The NFP saga captures the narrative perfectly. The 3-month average collapsed from 59k to -22k in Issue #009, what looked like a hiring freeze, then recovered to 78k in Issue #011 after the January print came in at 130k (well above the 70k consensus). But 2025’s total payroll growth was revised down by nearly 900,000 jobs. The labor market isn’t what anyone thought it was six months ago.
Lesson learned: when the core holds at zero while modifiers swing wildly, the correct read is usually that the core is right. Modifier tantrums create volatility. Core transitions create trends. Know which you’re trading.
Key Question: Where Is the Trajectory Pointing?
This is the question the zoom-out is designed to answer. Not “what happened this week” but “what does twelve weeks of data tell us about direction?”
Three data points from this week sharpen the picture:
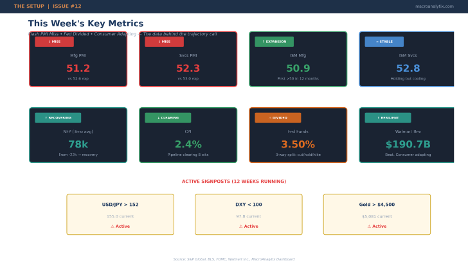
Flash PMI missed across the board. S&P Global’s February preliminary readings came in soft. Manufacturing at 51.2 (versus 52.6 expected), Services at 52.3 (versus 53.0 expected). The services reading is the weakest in ten months. Both are still above 50 (expansion territory) but the direction is wrong. Coming just weeks after ISM Manufacturing’s surge to 52.6 (its first expansion in twelve months), this creates another of those divergences we’ve been tracking since Issue #006. ISM says accelerating. S&P Global says decelerating. One of them is lagging. If the February ISM confirms the flash PMI’s deceleration signal, the Growth pillar faces its first serious test since the Stagflation scare, and the soft landing probability drops accordingly.
The Fed is deeply divided. Wednesday’s FOMC minutes from the January meeting revealed a committee split three ways: some want to cut, some want to hold, and several raised the possibility of hikes. That’s not a central bank with a clear direction. The minutes showed most participants worried about inflation remaining above target for longer than expected, even as they acknowledged the labor market was stabilizing. With Powell’s term ending in May and Warsh (widely seen as hawkish) nominated as successor, the policy trajectory is genuinely uncertain for the first time since we started publishing.
Walmart told us the consumer is adapting. Thursday’s Q4 results beat on both revenue ($190.7B) and earnings ($0.74 EPS). E-commerce grew 24% globally. Upper-income households are driving market share gains, trading down to value rather than cutting back. Walmart’s CFO said they’ve “largely absorbed the brunt of tariff impact” as an industry, with US inflation running just above 1% in Q4. The consumer isn’t cracking. They’re shifting and that distinction matters for the regime read.
Put the twelve weeks together and here’s what the trajectory shows:
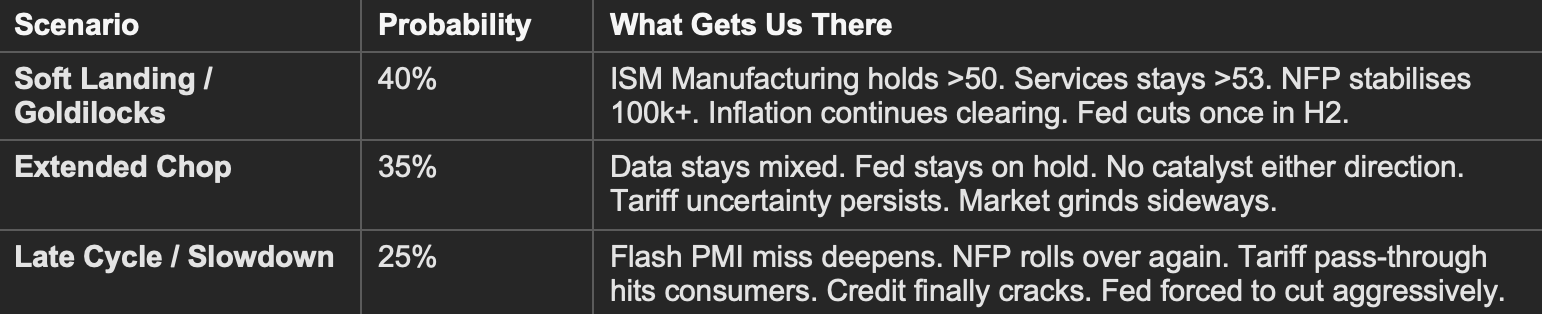
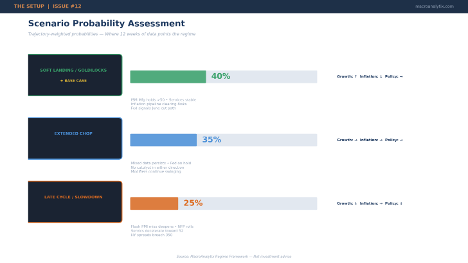
Why is Goldilocks the highest probability? Because the direction of the data favors it. ISM Manufacturing expanded for the first time in a year. NFP recovered from near-zero to 130k. CPI dropped to 2.4% from 2.7%. The inflation pipeline is clearing from upstream through downstream. Financial conditions remain loose. Real income hasn’t turned negative.
Why isn’t it higher than 40%? Because Friday’s flash PMI miss, the Fed’s three-way split and those three stubborn signposts all argue against certainty. The soft landing has been the base case for a year and a half. It keeps almost arriving and never quite getting there.
The Five Pillars: Trajectory View
Instead of the usual deep-dive into each pillar’s weekly data, here’s what the 12-week arc tells us about direction.
Growth: Resilient but unresolved. The divergence between ISM surveys and labor data has been the recurring tension since Issue #006. Services expansion has held above 53 consistently. Manufacturing just crossed back above 50. But NFP took a round trip from positive to negative to positive and the 2025 benchmark revision (-898k jobs) means the starting point was weaker than anyone knew. Friday’s flash PMI miss adds a new wrinkle, if the February ISM confirms deceleration, the growth pillar comes under pressure for the first time since the Stagflation scare. If it holds, the soft landing narrative strengthens materially.
Inflation: The most encouraging trajectory. Of all five pillars, inflation has the cleanest directional story. CPI dropped to 2.4%. Core PCE at 2.7-2.8% and drifting lower. Supercore decelerating from 3.6% to 3.4-3.5%. The pipeline model has been flashing “Disinflation: Pipeline Clearing” for eight consecutive weeks. Upstream commodities rolling over. Midstream expectations anchored at 2.1-2.2%. If this continues, Inflation could flip to -1 (falling) in the coming weeks and that would be unambiguously constructive for both bonds and equities. The tariff wild card remains but Walmart’s commentary suggests the retail sector has largely absorbed the initial shock.
Policy: Increasingly uncertain. The Policy pillar has been the most volatile modifier, swinging from +1 to -1 and back to 0 over twelve weeks. But the trajectory is shifting from “which way does the Fed lean?” to “who is the Fed?” Powell’s term ends in May. Warsh’s confirmation hearings will set the tone. A three-way split on the committee -cut, hold, or hike - is unusual and creates a wider distribution of outcomes than markets have priced since 2022. Financial conditions remain loose (NFCI at -0.56), but the Fed’s own uncertainty about its path forward is itself a headwind.
Liquidity: Structurally thin, tactically stable. The RRP buffer’s journey from $106B to near-zero has been one of the consistent themes. It’s done. Exhausted. Any future funding stress hits reserves directly. But week-to-week, net liquidity has stabilised, two consecutive weeks of modest injections. SOFR-repo spreads at zero. No plumbing stress. The December dislocation didn’t repeat. The structural concern (no buffer) persists, but the acute risk hasn’t materialised.
Risk Appetite: The swing factor. This pillar has been the regime’s protagonist, the only one to deviate from zero, and the one carrying the entire aggregate score. Its V-shaped recovery from -1 to +1 over three weeks validated the “modifier tantrum, not regime shift” thesis from Issue #010. But the Greed Ratio continues to deteriorate (1.298 and falling) even as validation checks pass. When institutional money rotates defensive while breadth holds, it’s usually accumulation, but it can also be early distribution. The next few weeks will tell which.
Cross-Asset Read: What the Trajectory Favours
The trajectory (not the weekly snapshot) suggests a regime that’s stabilising at a lower equilibrium than the Goldilocks peak of December. Growth positive but not accelerating. Inflation clearing but not cleared. Policy uncertain but not restrictive. That configuration has specific cross-asset implications.
Equities: Quality over beta remains the trajectory call. Twelve weeks of Neutral/Chop hasn’t rewarded aggressive cyclical bets. What it has rewarded is staying invested in quality, breadth above 58%, validation checks passing, HY spreads below 300. The flash PMI miss on Friday argues against chasing the recent dip aggressively. Wait for ISM confirmation. If Manufacturing holds above 50 and Services holds above 53, the dip is buyable. If they don’t, positioning should get more defensive.
Gold: The structural winner of 2026 so far. From $4,500 at the signpost trigger in Issue #005 to above $5,081 today. Central bank buying (863 tonnes in 2025), dollar weakness (DXY below 98), real rate compression, and Fed transition uncertainty all support the thesis. The trajectory says stay long structurally, manage tactically. Gold doesn’t need a recession uncertainty will do and uncertainty is the one thing we have in abundance.
Rates: The inflation trajectory is the clearest bullish signal for duration. If the pipeline continues clearing and the Fed eventually cuts, the long end benefits. But the FOMC’s three-way split and Warsh’s hawkish reputation create a ceiling on how much duration benefit you can capture near-term. The 10Y at 4.09% is fair value in a world where the Fed is genuinely uncertain. A break below 4% would signal the market pricing the soft landing path more aggressively.
FX: Same three signposts, twelve weeks running. USD/JPY, DXY, Gold. The carry unwind risk hasn’t materialised but hasn’t cleared either. The trajectory here is the most persistent warning the dashboard has produced. One day it will resolve, either quietly (yen stabilises, signposts clear) or violently (BoJ intervention, carry cascade). The longer it persists without resolution, the larger the eventual move.
Sources: MacroAnalytix Dashboard | FRED: https://fred.stlouisfed.org | ISM: https://www.ismworld.org | BLS: https://www.bls.gov | S&P Global: https://www.spglobal.com
What Would Change the View
Soft landing confirms: March ISM Manufacturing holds above 50. February NFP above 100k. CPI continues lower. Fed signals June cut. Growth pillar flips to +1. Goldilocks probability rises above 50%.
Flash PMI miss deepens: March ISM rolls over below 50. Services decelerate toward 52. NFP disappoints. Growth pillar goes negative for the first time since the Stagflation scare. Late Cycle probability rises sharply.
Fed clarity emerges: Warsh confirmation signals dovish or hawkish direction. The three-way split resolves. Policy pillar moves off zero for the first time in weeks.
Signposts clear or cascade: USD/JPY below 152 removes the carry risk that’s been flashing for twelve weeks. BoJ intervention triggers the cascade. Either way, the most persistent warning in the framework resolves.
Credit cracks: HY spreads above 350 would be the first real stress signal.
The Bottom Line
Twelve weeks of regime data tell a clearer story than any single week can.
The economy launched in Goldilocks territory, hit a Stagflation scare driven by transient stress and has spent the last seven weeks grinding through Neutral/Chop while the underlying data slowly improves. Growth is resilient. Inflation is clearing. Liquidity is stable. The core has held at zero through every modifier tantrum the market has thrown at it.
The trajectory points toward soft landing but softly. Not with the conviction of December’s peak optimism but with the quiet accumulation of evidence. Manufacturing crossed back above 50 for the first time in a year. NFP recovered. CPI dropped. The pipeline is clearing. These aren’t dramatic moves. They’re the kind of slow, grinding improvement that doesn’t make headlines but does change regimes.
The risks are real. Friday’s flash PMI miss. The Fed’s unprecedented three-way split. Twelve weeks of unresolved signposts. A Fed Chair transition that could reshape the policy trajectory. A tariff regime that hasn’t fully passed through. Any one of these could tip the balance.
But here’s what twelve weeks has taught me: trust the core pillars, not the modifier noise. The core has been remarkably stable through two modifier collapses, a Stagflation scare, and three signpost clusters. When the core moves, the regime is actually changing. When the modifiers move, the regime is being tested. Know the difference.
The trajectory says we’re grinding toward Goldilocks at 40% probability, with a meaningful 25% chance of Late Cycle if the data deteriorates. The next month of data(nMarch ISM, February NFP, the Warsh confirmation) will tell us which path we’re on. Until then, stay patient. The direction is slowly becoming visible through the fog.
See you next Sunday.
Questions or feedback? macroanalytix.research@gmail.com
Disclaimer
All content published by MacroAnalytix is for research and educational purposes only. Nothing in this publication should be interpreted as financial advice, investment recommendations, or a solicitation to buy or sell securities. You are solely responsible for your own financial decisions.