

Regime Check
Two weeks ago, I wrote that the heat was coming off. Policy and Risk Appetite had both cooled from +1 to neutral. The aggregate score drifted to zero. The message was clear: momentum was fading, but the foundation was intact. Sometimes the best trade is the one you don’t force.
This week, the foundation cracked. Policy has dropped from 0 to -1. Risk Appetite has dropped from 0 to -1. Both modifier pillars collapsed simultaneously, a two-pillar, two-point deterioration that pushes the aggregate score to -2 and triggers the dashboard’s Strong Headwind classification for the first time since we rebuilt the framework over the holidays.
Growth didn’t move. Inflation didn’t move. Liquidity didn’t move. The core regime (the Growth × Inflation matrix that determines which quadrant we’re in) is unchanged. We’re still in Neutral/Chop territory, position 5 of 9 on the regime grid. The engine is the same. But the modifiers, the Policy, Liquidity and Risk Appetite pillars that shape how the regime expresses across assets has turned.
Think of it this way: Growth and Inflation are the car. The modifiers are the road conditions. The car hasn’t broken down. But the road just iced over.
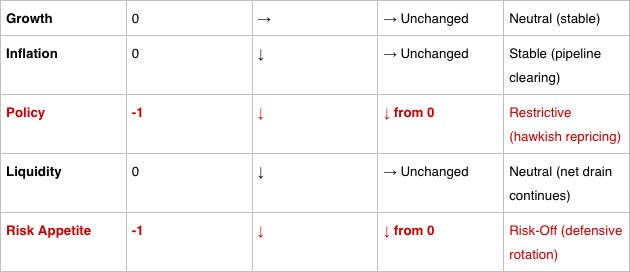
Current Regime: Neutral/Chop | Aggregate Score: -2 | Modifier: Strong Headwind | Conviction: Minimal
The weighted composite has dropped from 0 (Issue #008) to -2. That’s the lowest reading since the Stagflation scare in Issue #004 last December. The regime matrix still places us in the center of the grid, Neutral/Chop, because the core Growth × Inflation inputs haven’t shifted. But the modifier score of -2 means the headwinds are real.
The Stay Current probability has dropped to 40% (down from 50% in Issue #007 and 55% in Issue #005). The dashboard sees a 60% chance we’re transitioning somewhere else. The question is where.
Growth: The Anchor Holds
Growth is the quiet hero of this week’s read. While the modifiers collapsed around it, the growth pillar held steady at 0. Neutral, stable, doing exactly what it’s supposed to do in a soft landing environment.
ISM Services remains at 54.4, the strongest services reading we’ve seen this cycle outside the Issue #006 surge. GDPNow’s final Q4 2025 estimate sits at 4.2%, well above trend and inconsistent with the deterioration showing up in the modifier pillars.
But here’s what demands attention: the NFP 3-month average is at -22k. Net negative. Massive downward revisions to October payrolls (-173k, revised down 68k from initial) are driving the collapse. The labor market isn’t just slowing, it’s shrinking, quietly, without the headline drama.
The divergence check still shows Aligned with a Soft Landing implication. The saving graces: ISM Services at 54.4, Q4 GDPNow at 4.2% and real income ex-transfers hasn’t turned negative. The household health check that historically precedes recessions with ~80% accuracy when it flips.
We score Growth at 0 (Neutral), trend →. The NFP deterioration is the variable to monitor, if the 3-month average stays below 50k through February, the growth pillar comes under serious pressure. For now, the anchor holds. But the chain is getting shorter.
Inflation: Pipeline Clearing Continues
The genuinely good news holds. The pipeline model keeps flashing the same signal: Disinflation. Pipeline Clearing.
Core PCE remains at 2.7%, still above the Fed’s 2% target, but the trend is right. Supercore PCE (services ex-housing) continues its descent from the 4%+ readings that kept the Fed cautious through late 2025. Upstream commodities: stable. Midstream expectations: anchored. Downstream services: decelerating. The composition is healthy.
The tariff pressure flag is active but hasn’t flowed through to consumer-facing metrics. The pipeline model’s 3-6 month pass-through timeline puts the risk window in Q2.
We score Inflation at 0 (Stable), trend ↓. If downstream metrics confirm next month, this pillar could flip to -1 (falling) and that would be unambiguously constructive.
Policy: The Headwind Bites
Policy: The Headwind Bites
Policy has dropped from 0 to -1 (Restrictive), the first negative policy reading since Issue #001 last December, when the Fed was at 4.50-4.75% and QT was still running.
The mechanics are different now. Fed Funds are lower, QT has ended, cuts have been delivered. But the market’s repricing of the policy path has effectively tightened conditions regardless of where the nominal rate sits. Rate expectations have compressed. The front end has repriced higher. Financial conditions have tightened enough to flip the score negative.
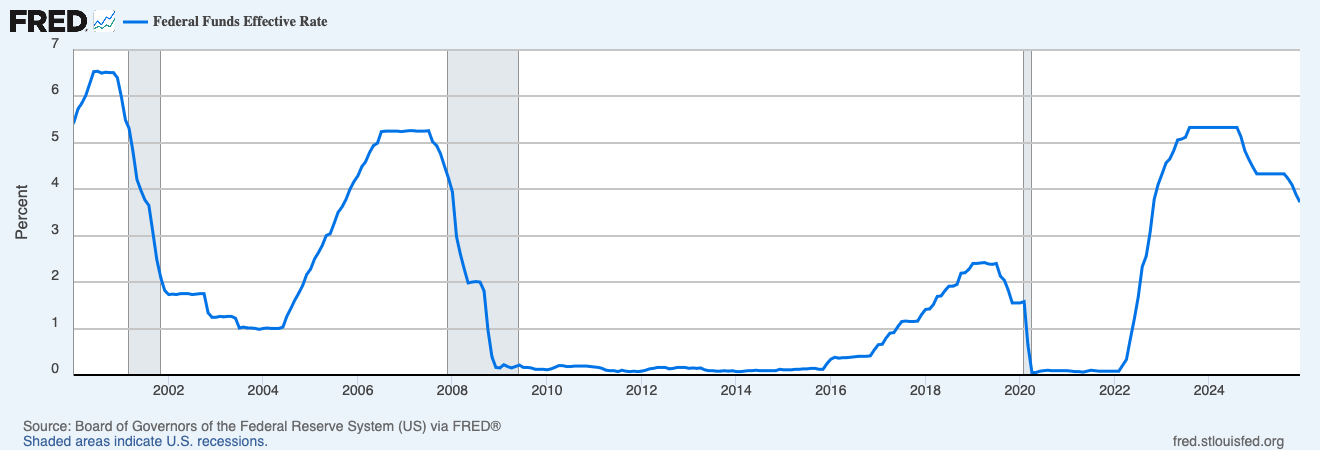
Source: https://fred.stlouisfed.org/series/fedfunds#
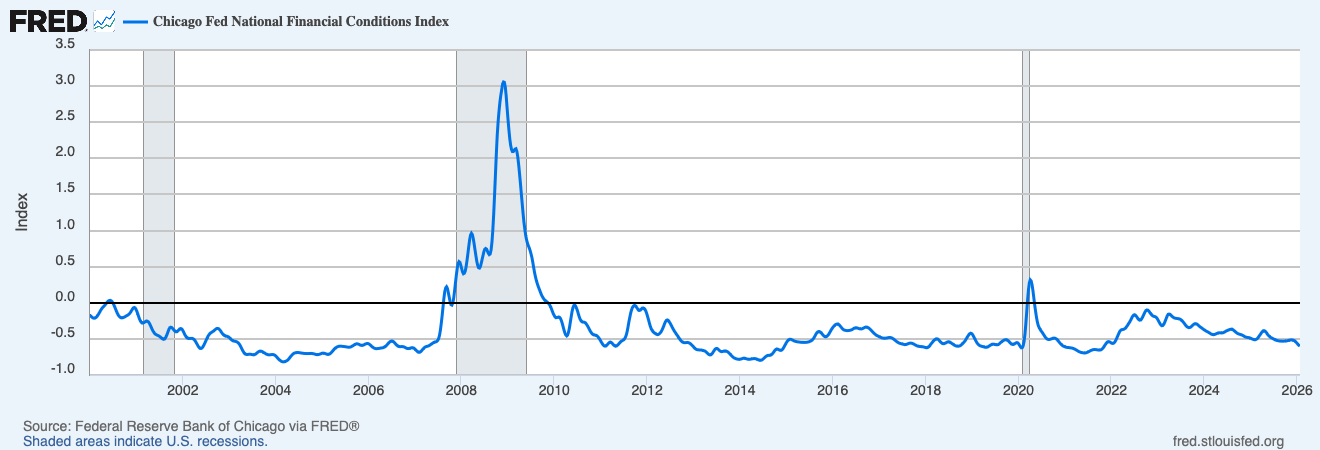
Source: https://fred.stlouisfed.org/series/NFCI#
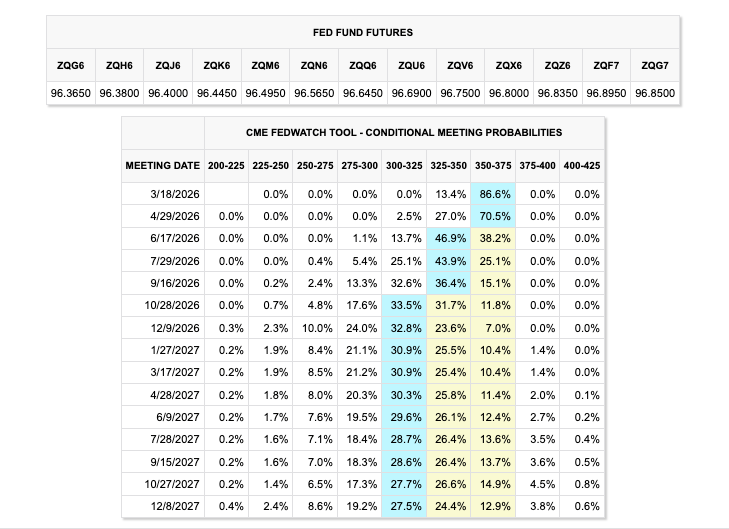
Source: https://www.cmegroup.com/markets/interest-rates/cme-fedwatch-tool.html
The fiscal side remains stimulative with budget deficits near 6% of GDP. But monetary tightening through market expectations is dominating. The Policy Mix Matrix reads: Monetary Tight / Fiscal Loose which is a conflicted configuration that typically produces elevated volatility rather than a clean directional move.
We score Policy at -1 (Restrictive), trend ↓. The Fed hasn’t changed its stance—the market has changed its interpretation.
Liquidity: The Quiet Drain
Liquidity holds at 0, but the trend is deteriorating. Net liquidity has dropped $57.6 billion, a 1.01% decline to $5,654.9 billion. The RRP has recovered slightly to $9.6 billion from near-zero, but any funding stress hits reserves directly.
The plumbing metrics remain functional, SOFR-repo spreads are well-behaved, no funding market stress signals. This is a slow structural drain, not a dislocation. But slow drains lower the system’s resilience to shocks.
We score Liquidity at 0 (Neutral), trend ↓. The quiet drain continues.
Risk Appetite: The Other Shoe Drops
Risk Appetite has collapsed from 0 to -1 (Risk-Off), the first negative reading since we launched.
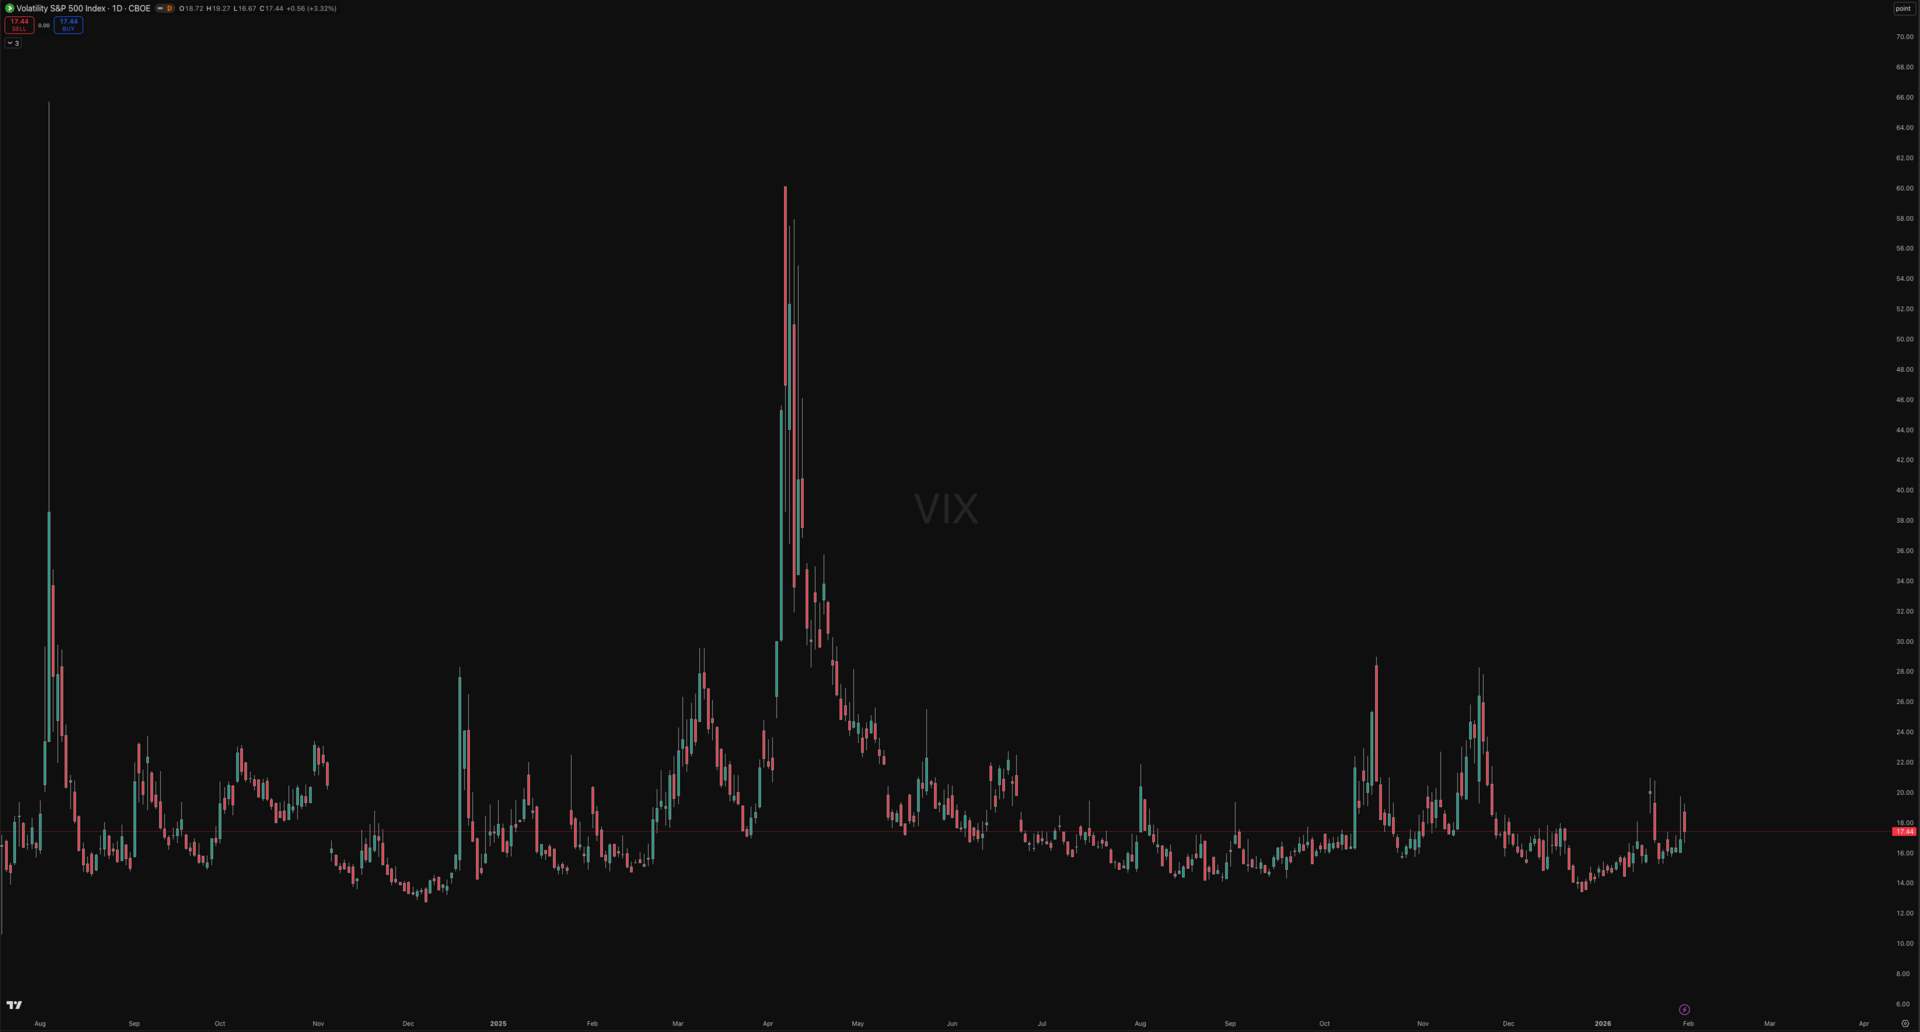
The VIX has risen to 17.44, up meaningfully from sub-15 complacency readings in Issues #004-005. HY credit spreads have widened 9 basis points to 277, still historically tight, but the direction is wrong.
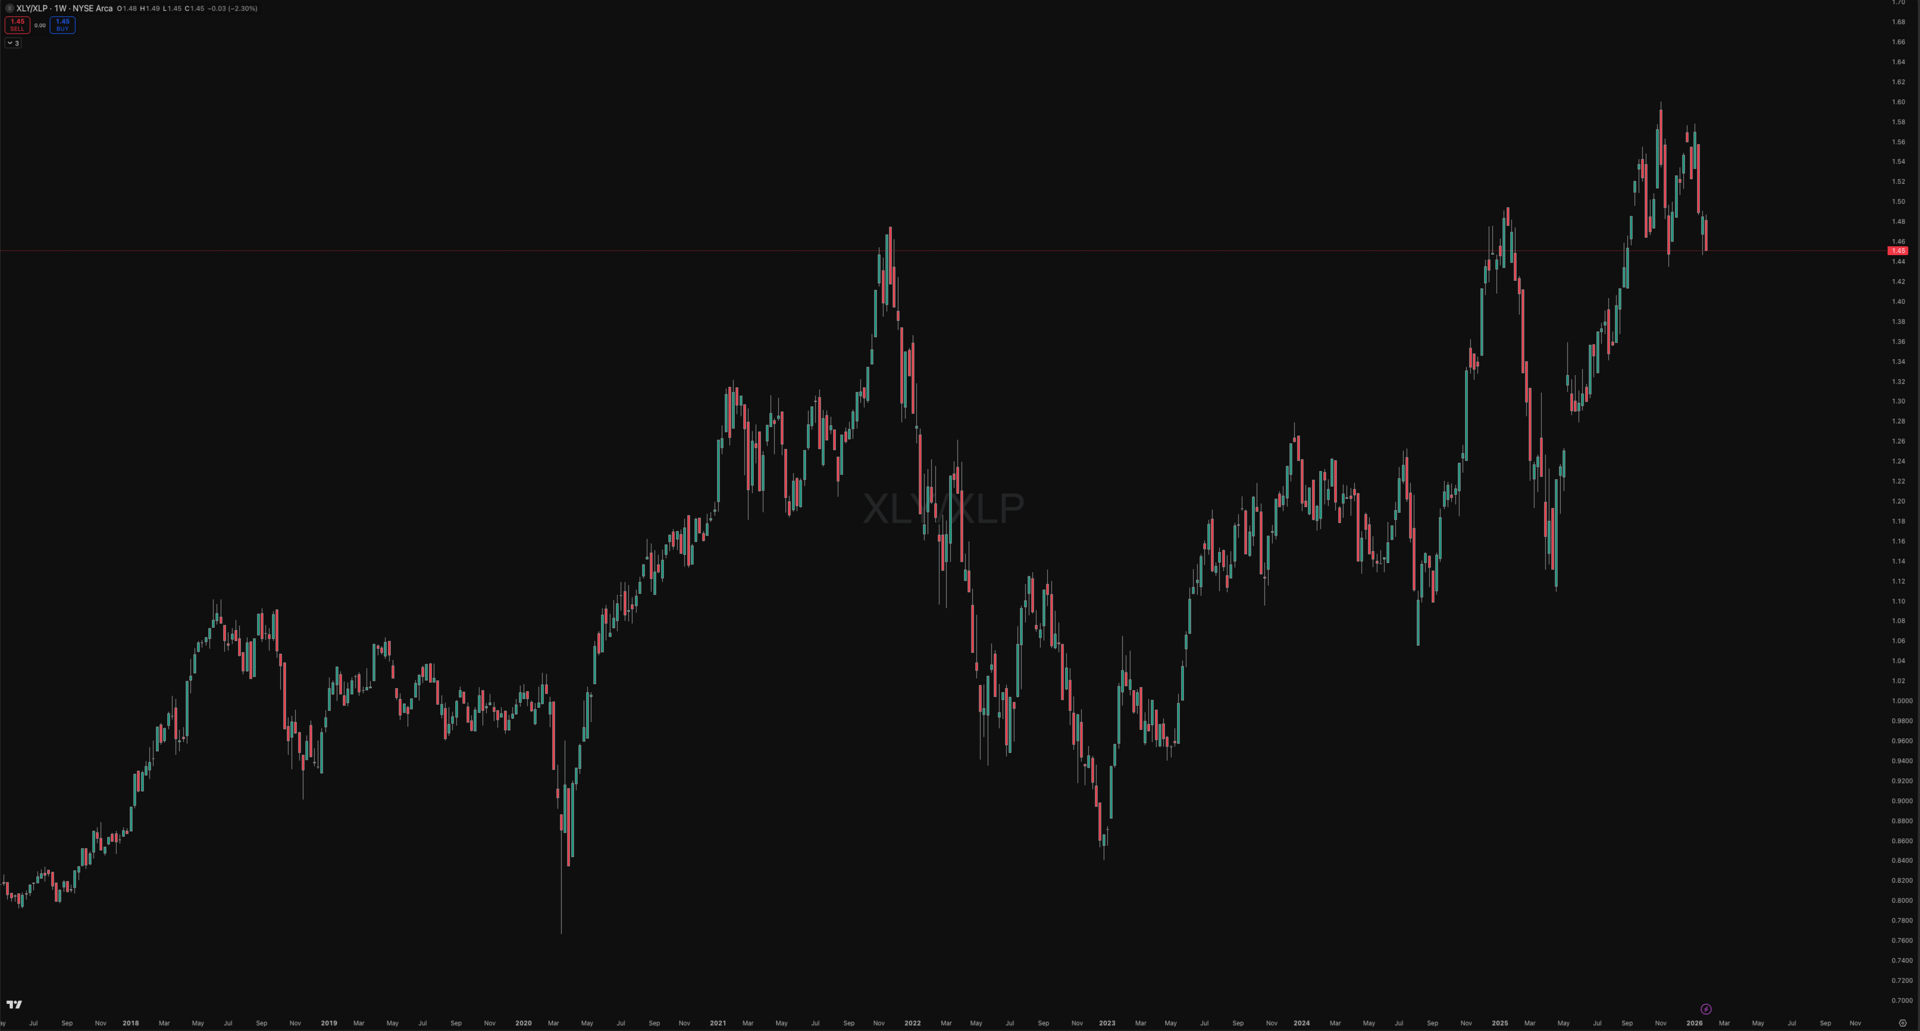
The real tell is the Greed Ratio. The XLY/XLP ratio has dropped to 1.45, triggering a FAIL signal on the validation dashboard. When staples outperform discretionary, institutional money is rotating from offence to defence.
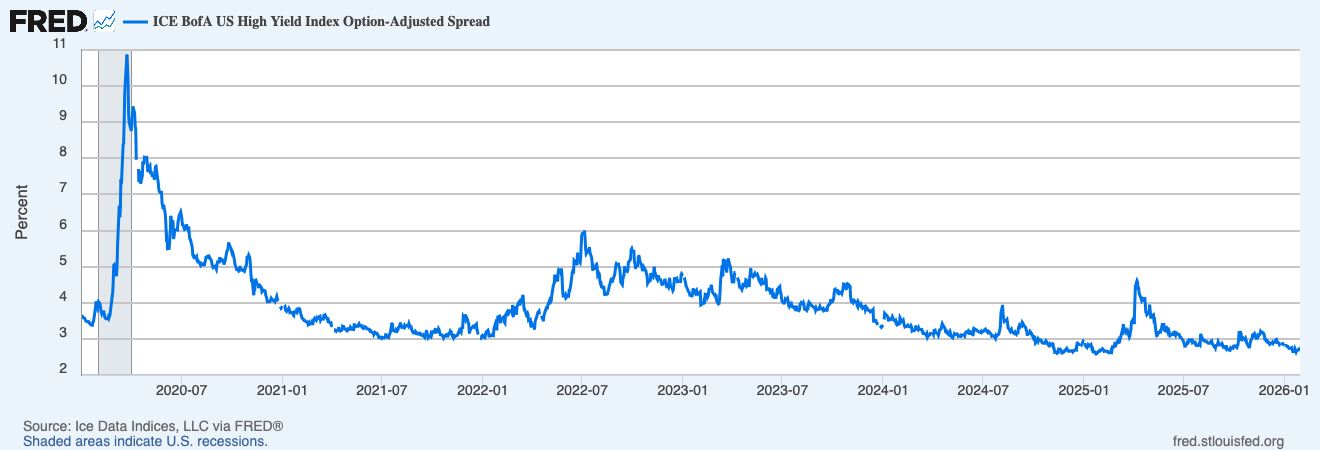
Source: https://fred.stlouisfed.org/series/BAMLH0A0HYM2/#
Signal validation reads 3 of 4 PASS. Credit, internals, and global checks pass. Greed Ratio fails. Breadth at 61.5% offers a counterpoint, healthy and above the 50% trouble threshold.
We score Risk Appetite at -1 (Risk-Off), trend ↓. The defensive rotation is real. The Greed Ratio FAIL is new.
China: Quiet Improvement
China Score at +1 with zero risk flags. FXI holding above key levels, yuan stabilised, Caixin PMI above 50. The copper/gold ratio remains the tell, until it recovers, the improvement narrative is still hopeful at best.
Signpost Status: Same Three, Deeper
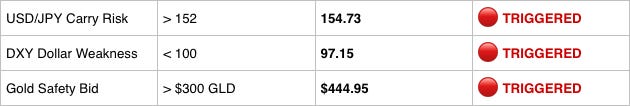
The same three currency signposts from Issue #005 remain active.
With Policy and Risk Appetite both at -1, the signpost cluster is no longer isolated—it’s consistent with the broader modifier deterioration. That alignment increases the probability the signal is real.
Transition Probabilities
The dashboard’s transition probability matrix has shifted materially from Issue #007:
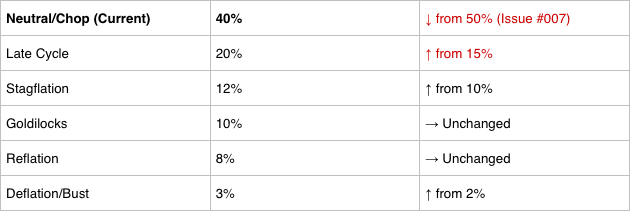
The probability distribution has shifted bearish. Late Cycle is now 20%, up from 15%. The combined bear case (Late Cycle + Stagflation + Deflation) sits at 35%, up from 27%. The combined bull case (Goldilocks + Reflation) remains at 18%. The asymmetry tilts to the downside.
Key Question of the Week: What Happens When Modifiers Collapse but the Core Holds?
This is the analytical puzzle the framework hasn’t encountered before. In every previous regime shift, the core pillars moved first. This week is different, the core is stable and the modifiers are crumbling.
The NFP collapse may be a lagging confirmation of something the modifiers are seeing first. If hiring has effectively stalled, the services expansion at 54.4 could be running on fumes, companies still busy with existing demand but no longer adding capacity.
The Greed Ratio FAIL has a track record. When staples outperform discretionary, it’s institutional money de-risking before the headlines catch up.
Policy headwinds feed into growth with a lag. Today’s tighter financial conditions become tomorrow’s weaker lending standards and investment decisions over 2-4 quarters.
Here’s the bull case:
Modifiers can recover as fast as they deteriorate. Policy went from -1 to +1 in three weeks back in December. Breadth at 61.5% is healthy, when breadth holds while sentiment weakens, it’s often a setup for recovery.
The inflation pipeline clearing gives the Fed an out. If disinflation continues, the one-cut guidance becomes stale and the policy headwind reverses.
My read: The modifier deterioration is real but potentially temporary. The core regime is doing exactly what it should in a soft landing. The headwinds are coming from market repricing. That makes this a volatility event rather than a regime event, at least until the growth pillar confirms what the modifiers suggest. The 20% Late Cycle probability isn’t trivial.
Cross-Asset Read
The regime is Neutral/Chop with Strong Headwind modifiers. Here’s how that configuration typically expresses across asset classes.
Equities: The Greed Ratio FAIL is the clearest signal, defensive sectors outperforming cyclicals. Historically, Neutral/Chop regimes with negative modifiers favor quality and stability over beta and speculation. Breadth at 61.5% suggests the broader market isn’t breaking down, but the internal rotation toward defensives is real and consistent with late-cycle dynamics.
Bonds: The tension between restrictive policy repricing and improving inflation creates a mixed regime for duration. The curve dynamics remain interesting, if growth eventually follows the modifiers lower, front-end repricing accelerates while the long end stays anchored on fiscal concerns. The inflation pipeline clearing is structurally supportive for bonds, but the policy headwind argues against aggressive duration positioning until there’s confirmation.
FX: All three triggered signposts point to dollar weakness and carry risk. DXY below 100, USD/JPY in intervention territory and gold’s structural rally tell a consistent story. The modifier collapse adds a layer of US-specific concern. The BoJ remains the wildcard, any hawkish language at these USD/JPY levels could trigger the carry unwind cascade we’ve monitored since Issue #005.
Commodities: Gold continues to benefit from the regime configuration, dollar weakness, falling real rate expectations, persistent central bank buying and rising uncertainty. The structural bid remains intact. Industrial metals and energy lack a catalyst, the copper/gold ratio is depressed, China’s improvement hasn’t translated to demand and OPEC+ dynamics are unclear. The regime offers no edge in cyclical commodities.
Crypto: BTC tends to correlate with net liquidity. Net liquidity is draining, down $57.6 billion, and the modifier collapse adds headwinds for speculative assets. The dashboard’s risk appetite score at -1 is historically unfavorable for crypto, which sits at the extreme end of the risk spectrum. The structural bull narrative (halving cycle, institutional adoption) doesn’t change, but the regime backdrop has deteriorated.
What Would Change the View
The current regime is Neutral/Chop with Strong Headwind modifiers. Here’s what would shift the assessment:
Growth pillar flips negative. ISM Services below 50 collapses the soft landing thesis. NFP 3-month average staying below 50k through February confirms the hiring freeze. Real income ex-transfers turning negative would be the household health check failing.
Modifiers recover. One dovish Fed signal could flip Policy back to 0. A strong NFP print could snap Risk Appetite to neutral. These pillars are volatile, the Strong Headwind could be temporary.
Credit cracks. HY spreads above 400bps would signal validation checks failing. Currently 277, distant, but the Greed Ratio FAIL is often leading indicator number one. Credit widening would be number two.
Carry unwind materializes. USD/JPY reversing on BoJ intervention would resolve the three signpost cluster painfully.
Inflation pipeline reverses. Core PCE above 3.0% or tariff pass-through in downstream CPI would kill the disinflation signal. Currently the lowest-probability risk.
The Bottom Line
We’re in Neutral/Chop with the worst modifier reading since we launched. The core regime hasn’t moved. Growth and Inflation are doing exactly what they should in a soft landing but Policy and Risk Appetite have both collapsed to -1, and the dashboard is flashing Strong Headwind for the first time.
The tension is between the stable engine and the icy road. ISM Services at 54.4 and Q4 GDPNow at 4.2% say the economy was fine through year-end. The Greed Ratio FAIL and NFP collapse to -22k say something is shifting beneath the surface. The inflation pipeline clearing says the constraint is loosening. The signpost cluster says dollar weakness and carry risk haven’t gone away.
The 40% Stay Current probability is the lowest we’ve seen. The asymmetry tilts bearish, 35% combined bear case versus 18% bull case. The dashboard can’t tell you whether the modifiers are leading or lagging, only time will answer that. What it can tell you is that when the headwinds are this strong, the framework says pay attention.
Let the core pillars tell you when the regime is actually changing, not when the modifiers are throwing a tantrum. And watch NFP because if the 3-month average doesn’t recover in February, the tantrum becomes a trend.
See you next Sunday.
Questions or feedback? macroanalytix.research@gmail.com
Disclaimer
All content published by MacroAnalytix is for research and educational purposes only. Nothing on this site or in our publications should be interpreted as financial advice, investment recommendations, or a solicitation to buy or sell securities. You are solely responsible for your own financial decisions. Please conduct your own due diligence and consult with a licensed financial professional before making any investment decisions.