

Introduction
Some questions deserve more space. That’s what The Breakdown is for, stepping back from the week-to-week noise to examine the bigger picture.
For this inaugural issue, we’re going back to the foundation of everything. Where are we in the economic cycle, how did we get here and what comes next? The timing couldn’t be more appropriate, the dashboard just flipped to Stagflation, multiple signposts have triggered simultaneously and markets are pricing a world where none of it matters.
Understanding your position in the cycle is the single most important input to positioning. More than any individual data point. More than any earnings report or Fed meeting. The regime dictates what works and what doesn’t across asset classes. Get it right, and the rest follows. Get it wrong and you’re fighting the tape.
The post-pandemic cycle has been unlike anything in modern market history. Unprecedented fiscal and monetary stimulus. The fastest inflation spike in forty years. The most aggressive hiking cycle since Volcker. And now, an easing cycle beginning with inflation still sticky and growth still positive. It’s a lot to make sense of.
Where We Are
The Current Regime
The regime just flipped. And not in a good way.
As of this week’s assessment, the dashboard is flashing Stagflation, the one regime nobody wants to see. Growth has turned and shows signs of contracting. Not slowing, contracting. ISM Manufacturing stuck at 48.2 for the tenth consecutive month. Initial claims ticking higher. The Conference Board Leading Index down 2.1% over six months. The composite growth score has flipped negative for the first time since we started publishing.
Meanwhile, inflation is sending unwanted signals. Core PCE is sat at 2.80%.- not great with the addition of Core CPI at 3%. The dashboard scores inflation as elevated, but the trend may be turning.
The tension is real. We’re ending 2025 with the dashboard flashing Stagflation while equity markets sit near all-time highs, credit spreads are historically tight, and volatility trades like everything is fine. AI optimism, fiscal support, and resilient services employment are legitimate bull arguments. The signposts could be early or they could be wrong.
Weighted Score: 1.219 (down from 1.92 last week). The composition has shifted dramatically: Growth flipping negative while inflation stays elevated puts us in the Stagflation quadrant of the regime matrix. But the CPI improvement, stable services, and accommodative policy are genuine offsets. This isn’t a screaming sell signal, it’s a caution flag.
The Five Pillars Today
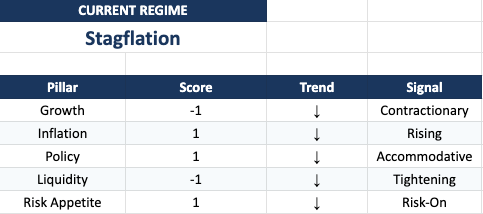
Growth (-1, trending down)
The growth pillar just flipped negative, first time since we launched. ISM Manufacturing remains stuck at 48.2, the tenth consecutive month below 50. Initial claims have ticked up to 217,500 on the four-week average - still historically low, but moving in the wrong direction from 208,300. Retail sales decelerated to 3.5% year-over-year from 4.3%.
ISM Services at 52.6 is the saving grace, services represent roughly 70% of the economy and they’re still expanding, barely. But the margin of safety has narrowed.
This is the most significant regime shift since we started publishing.
Inflation (+1, trending down)
The inflation picture is genuinely mixed. Core CPI hovering around 3%. Core PCE tells a similar story, ticking to 2.80%. Any divergence matters because the Fed watches PCE, not CPI. But market-based measures are behaving well: the 5Y5Y breakeven has drifted down to 2.18%, the lowest reading this year.
The honest assessment: inflation is no longer the clear headwind it was. Future CPI prints could give the Fed more room to manoeuvre if growth deteriorates.
Policy (+1, trending down)
The Fed cut 25 basis points this month, bringing the target range to 3.50-3.75%. The dot plot showed only one additional cut projected for 2026, far fewer than markets expected. Three dissenting votes - the most since 2019 - signal a committee that doesn’t know where it’s going.
But here’s what matters now: if growth deteriorates further, the Fed has room to cut. The improving CPI gives them cover. Policy is accommodative and could become more so if the signposts are right about recession risk.
Liquidity (-1, trending down)
The overnight RRP has been completely drained - the liquidity buffer is gone. SOFR-repo spreads have normalized from their December stress, but the structural concerns remain. The TGA continues to drain reserves. The Fed’s $40 billion T-bill buying program helped navigate year-end, but the plumbing requires ongoing attention.
The acute stress didn’t materialize, but the cushion is thinner than it was.
Risk Appetite (+1, trending up)
And here’s the disconnect that defines this moment. The VIX sits below 15 pricing a world where none of the warning signals matter. Credit spreads remain historically tight at 285-290 basis points. Equities are near all-time highs.
Markets are pricing confidence while the leading indicators flash caution. Either the signposts are early, or markets are complacent. We’ll find out which.
The Valuation Problem
Here’s what makes this moment so uncomfortable: the dashboard says Stagflation, but valuations say everything is fine.
The S&P 500 at 22x forward earnings isn’t just expensive, it’s priced for perfection in an environment where four recession signposts have triggered. At these multiples, a 10% earnings miss implies roughly 15% drawdown to restore fair value. The Shiller P/E sits at the 99th percentile historically. High-yield spreads at 285-290 basis points are near historically tight levels only reached in May 2007 and briefly in 2021. Credit investors aren’t being paid for risk.
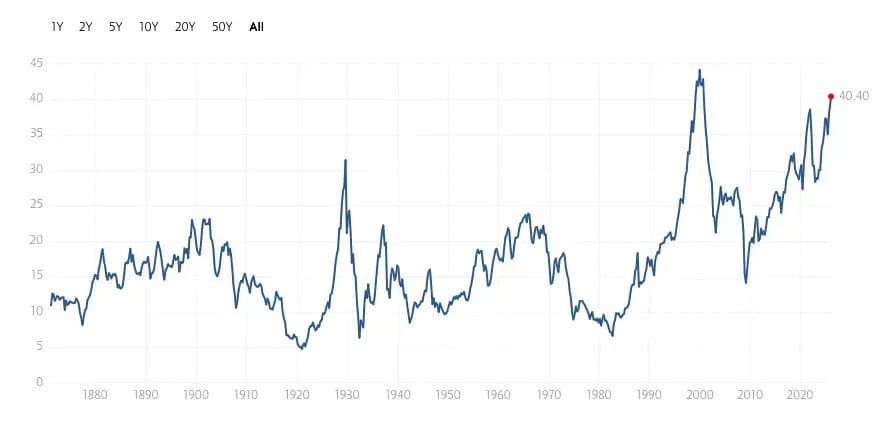
Source: Shiller CAPE Ratio
This is the core tension: either the signposts are wrong and markets are correctly pricing resilience, or markets are complacent and the signposts are early. History suggests the signposts deserve respect - they’ve preceded every modern recession. But they’ve also given false positives. The disconnect has to resolve, one way or another.
How We Got Here
The current regime is the product of a policy sequence that started in March 2020. You can’t understand where we are without understanding the path that brought us here.
The Pandemic Response (2020-2021)
When COVID hit, policymakers reached for every tool in the box and invented some new ones.
The Fed cut rates to zero in two emergency moves totaling 150 basis points. Then came QE at a scale that made the post-GFC programs look modest: nearly $5 trillion in asset purchases over two years. The Fed’s balance sheet ballooned from $4.2 trillion to over $9 trillion. Fiscal policy was even more aggressive - over $5 trillion in direct support through stimulus checks, enhanced unemployment benefits, and PPP loans.
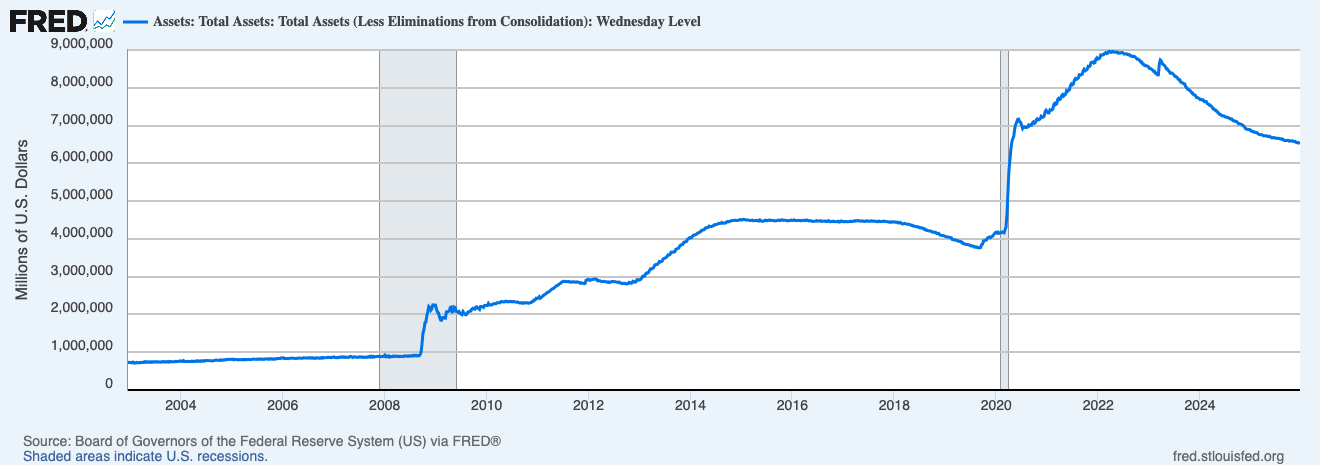
Source: FRED Series WALCL (https://fred.stlouisfed.org/series/WALCL)
The combination was unprecedented. Simultaneous fiscal and monetary stimulus at emergency scale, delivered into an economy where supply chains were breaking and demand patterns were shifting dramatically. The result was a recovery unlike any in history. Real GDP recovered to pre-pandemic levels by Q1 2021, far faster than the six years it took after the Global Financial Crisis.
But the seeds of inflation were planted. Trillions in stimulus chasing constrained supply. Supply chains that couldn’t deliver. Labor markets that couldn’t fill positions. The question wasn’t whether inflation would arrive. The question was how bad it would get.
The Inflation Surge (2021-2022)
By mid-2021, inflation was running hot. CPI broke above 5% in May. The Fed called it “transitory.”
The bet was that supply chain normalization would resolve price pressures without policy tightening. Base effects would fade. Demand would moderate. The economy would find equilibrium.
The bet was wrong.
Inflation kept climbing. Supply chains remained tangled. Russia’s invasion of Ukraine in February 2022 sent energy prices soaring. By June 2022, headline CPI hit 9.1% - the highest reading since November 1981. Core PCE peaked at 5.6%. The “transitory” narrative collapsed.
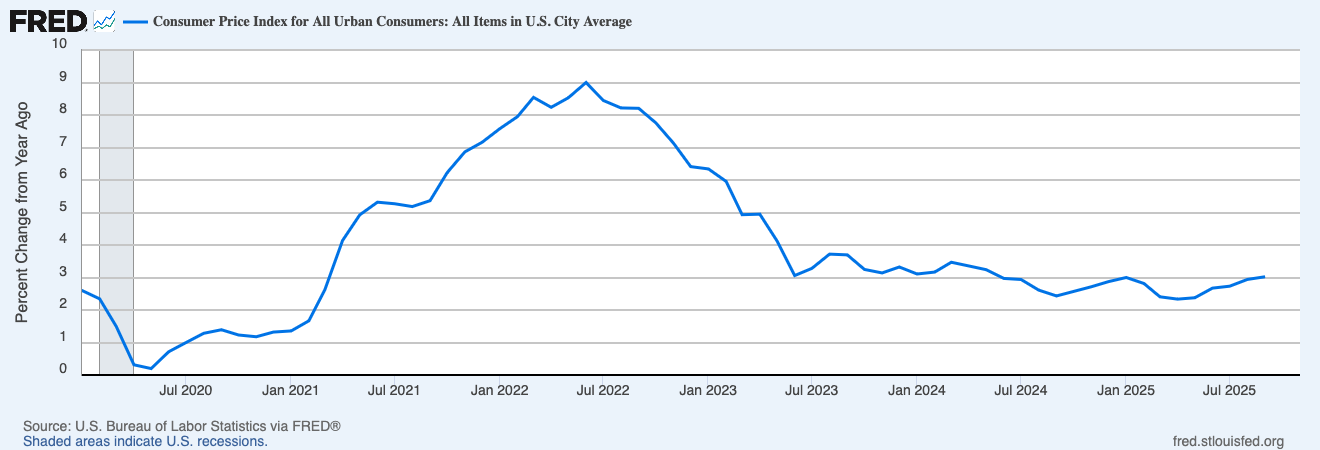
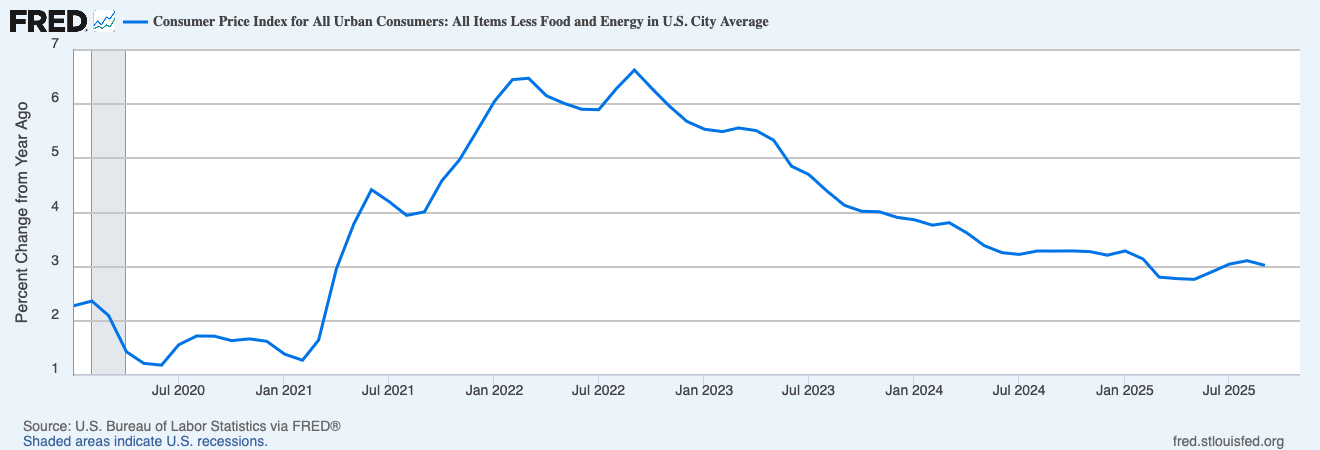
Source: https://fred.stlouisfed.org/series/CPIAUCSL https://fred.stlouisfed.org/series/CPILFESL
The Fed’s delayed response became one of the most significant policy errors in recent memory. By the time they acknowledged the problem, inflation had become embedded in expectations, wage negotiations and pricing behavior. The easy path back to 2% had closed.
The Hiking Cycle (2022-2023)
What followed was the fastest tightening cycle in forty years.
From March 2022 to August 2023, the Fed raised rates 525 basis points - from near zero to 5.25-5.50%. That’s eleven rate hikes in eighteen months, including four consecutive 75 basis point moves. The pace was aggressive by design. Having been late to respond, the Fed overcompensated with front-loaded tightening.
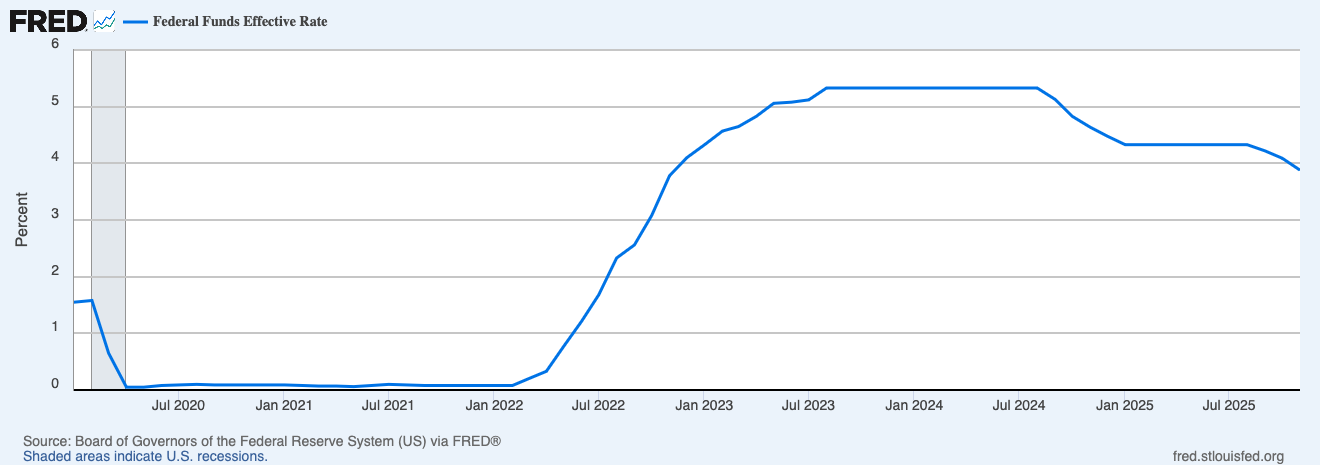
Source: FRED Series FEDFUNDS (https://fred.stlouisfed.org/series/FEDFUNDS).
Simultaneously, quantitative tightening began draining liquidity from the system. The Fed’s balance sheet shrank by over $1 trillion as maturing securities rolled off without reinvestment. The combination of higher rates and reduced liquidity created a double headwind for risk assets.
The impact was immediate. The 60/40 portfolio suffered its worst year since 1937 as both stocks and bonds declined together - the diversification that investors relied on failed spectacularly. Regional banks cracked in March 2023 as duration losses on bond portfolios combined with deposit flight. Silicon Valley Bank, Signature Bank, and First Republic collapsed in quick succession.
And yet, the recession that everyone predicted never arrived. The economy absorbed 525 basis points of tightening without rolling over. Employment stayed strong. Consumer spending held. The soft landing - which seemed impossible through most of 2022—remained on the table.
The Plateau (2024-2025)
From August 2023 through August 2024, rates sat at 5.25-5.50%—the “higher for longer” plateau.
This was the Fed’s attempt to finish the job without triggering the recession they’d narrowly avoided. Inflation was falling but still above target. Growth was slowing but still positive. The soft landing required threading a needle: rates high enough to complete disinflation, but not so high as to break the economy.
By September 2024, the Fed judged the balance of risks had shifted. Core PCE had fallen from 5.6% to under 3%. The labor market was cooling. They began cutting—50 basis points in September, 25 in November, 25 in December. The easing cycle had begun.
But here’s the problem: inflation stopped cooperating. Core PCE has been stuck in the 2.7-3.0% range for most of 2025. The last mile to 2% isn’t materializing. And this latest dot plot made the Fed’s uncertainty explicit: only one cut projected for 2026. The easing cycle that markets assumed would continue has effectively paused.
That’s how we got here: pandemic stimulus, inflation surge, aggressive tightening, near-miss recession, plateau, cautious easing, and now... uncertainty.
The Fed is cutting into an economy that isn’t obviously weak, with inflation that isn’t obviously falling. That’s unusual. And it leaves the path forward genuinely unclear.
What Comes Next
The regime framework doesn’t predict the future. It maps the possible paths and identifies what would trigger each. Here are the three scenarios for 2026—with probabilities, triggers, and cross-asset implications.
Scenario 1: Soft Landing (45-50% probability)
The thesis: Growth stabilizes before cracking. The leading indicators prove early rather than prescient. Inflation continues its recent improvement. The Fed delivers 2-3 cuts in 2026 as the data cooperates. Services hold the line while manufacturing finds a floor. The economy achieves the elusive soft landing - just later and messier than hoped.
What would confirm it: ISM Manufacturing crossing back above 50. ISM Services holding above 52 and ideally accelerating toward 54. Payrolls staying positive at 100-200k per month. Unemployment stabilizing around 4.3-4.5%. Core PCE trending toward 2.5% by mid-2026, confirming the CPI improvement. Credit spreads remaining well-behaved. The LEI stabilizing rather than deteriorating further.
Cross-asset implications: Small caps outperform as rate sensitivity works in reverse. The Russell could see a decent upside. Financials continue working - steeper curves, healthy credit, valuation discount closes. Duration rallies modestly as 10-year yields fall 30-40 basis points. Credit carries without incident. Dollar drifts lower, EUR/USD reaches 1.19-1.20. Commodities are mixed - gold consolidates, energy tracks growth.
Scenario 2: Hard Landing (30-35% probability)
The thesis: The signposts are right. The LEI’s recession warning proves accurate, as it has before every modern recession. The lagged effects of 525 basis points of tightening finally bite. Services follow manufacturing below 50. We get the recession that everyone expected in 2023 - delayed by two years, arriving just as markets stopped looking for it.
Why the probability rose: This scenario was 20-25% a month ago. Four simultaneous signpost triggers - LEI negative, curve uninversion, RRP exhaustion, VIX complacency - pushed it to 30-35%. The LEI’s track record matters here: readings of -2.1% have preceded every modern recession, typically by 6-12 months. False positives exist (2016, 2019), but dismissing the signal entirely would not be advised.
What would trigger it: ISM Services breaking below 50—that’s the key domino. Payrolls turning negative. Unemployment spiking above 5%. Credit spreads widening above 400 basis points. Consumer spending rolling over as the labor market softens. A credit event in commercial real estate or leveraged lending. The current LEI reading of -2.1% suggests 6-12 month lead time if the historical pattern holds.
Cross-asset implications: Equities down 20-30% as earnings expectations collapse. Small caps and cyclicals get destroyed. Duration rallies hard - 10-year yields could fall to 3.0-3.5% as the Fed pivots aggressively. Credit spreads blow out to 600+ basis points. Dollar strength returns as risk-off bid kicks in. Gold rallies on safe-haven demand. Commodities crash on demand destruction.
Scenario 3: No Landing (15-20% probability)
The thesis: The growth weakness proves temporary. The leading indicators give another false positive, as they did in 2016 and 2019. But inflation reaccelerates -perhaps driven by tariffs, perhaps by resilient demand that the manufacturing data is missing. The Fed is forced to pause or even reverse the cutting cycle. We’re back to “higher for longer,” but this time with less credibility and more uncertainty.
What would trigger it: Core PCE breaking above 3.0%. CPI surprising persistently hot. Wage growth reaccelerating above 4.5%. ISM prices paid surging. Tariff pass-through adding 1-1.5% to inflation. Long-term inflation expectations becoming unanchored—5y5y breakevens breaking above 2.5%.
Cross-asset implications: Equities struggle as the multiple compresses - the Fed put evaporates. Growth stocks under-perform sharply. Duration gets crushed as long-end yields reprice higher - 10-year could push toward 5.0%. Steepeners work overtime. Real assets outperform: commodities, TIPS, real estate. Dollar strengthens on higher real rates. Gold sells off initially as real rates rise, then potentially rallies on inflation fears.
The Wildcards
These three scenarios assume the macro environment evolves organically. But there are factors that could override the base case:
Tariffs: The administration has signaled aggressive trade policy and the specifics matter. The proposed framework includes a 10-20% universal tariff on all imports plus a 60% tariff on Chinese goods. If fully implemented, estimates suggest this could add 1.0-1.5% directly to PCE inflation, with second-round effects potentially pushing that higher. The average effective tariff rate is already at 11-16% - the highest since 1943 - and these proposals would roughly double it. For context, the 2018-2019 tariffs added approximately 0.3% to core inflation. This is a different magnitude entirely. If tariffs escalate as proposed, the “no landing” scenario becomes significantly more likely. This is the variable the framework doesn’t fully capture and it’s potentially the dominant 2026 wildcard.
Fed Independence: Governor Miran - the sole Trump appointee on the committee - has now dissented for larger cuts at three consecutive meetings. Powell’s term ends in May 2026. The questions around Fed independence haven’t mattered for markets since the early 1970s. They might matter again.
Geopolitics: Taiwan, Ukraine, Middle East. Any escalation could trigger supply shocks, safe-haven flows, and regime shifts that override the cyclical analysis. These are low-probability events with outsized impact. They’re hard to position for but important to acknowledge.
The Signposts
Multiple signposts have already triggered. Rather than predicting which scenario unfolds, watch for confirmation or contradiction:
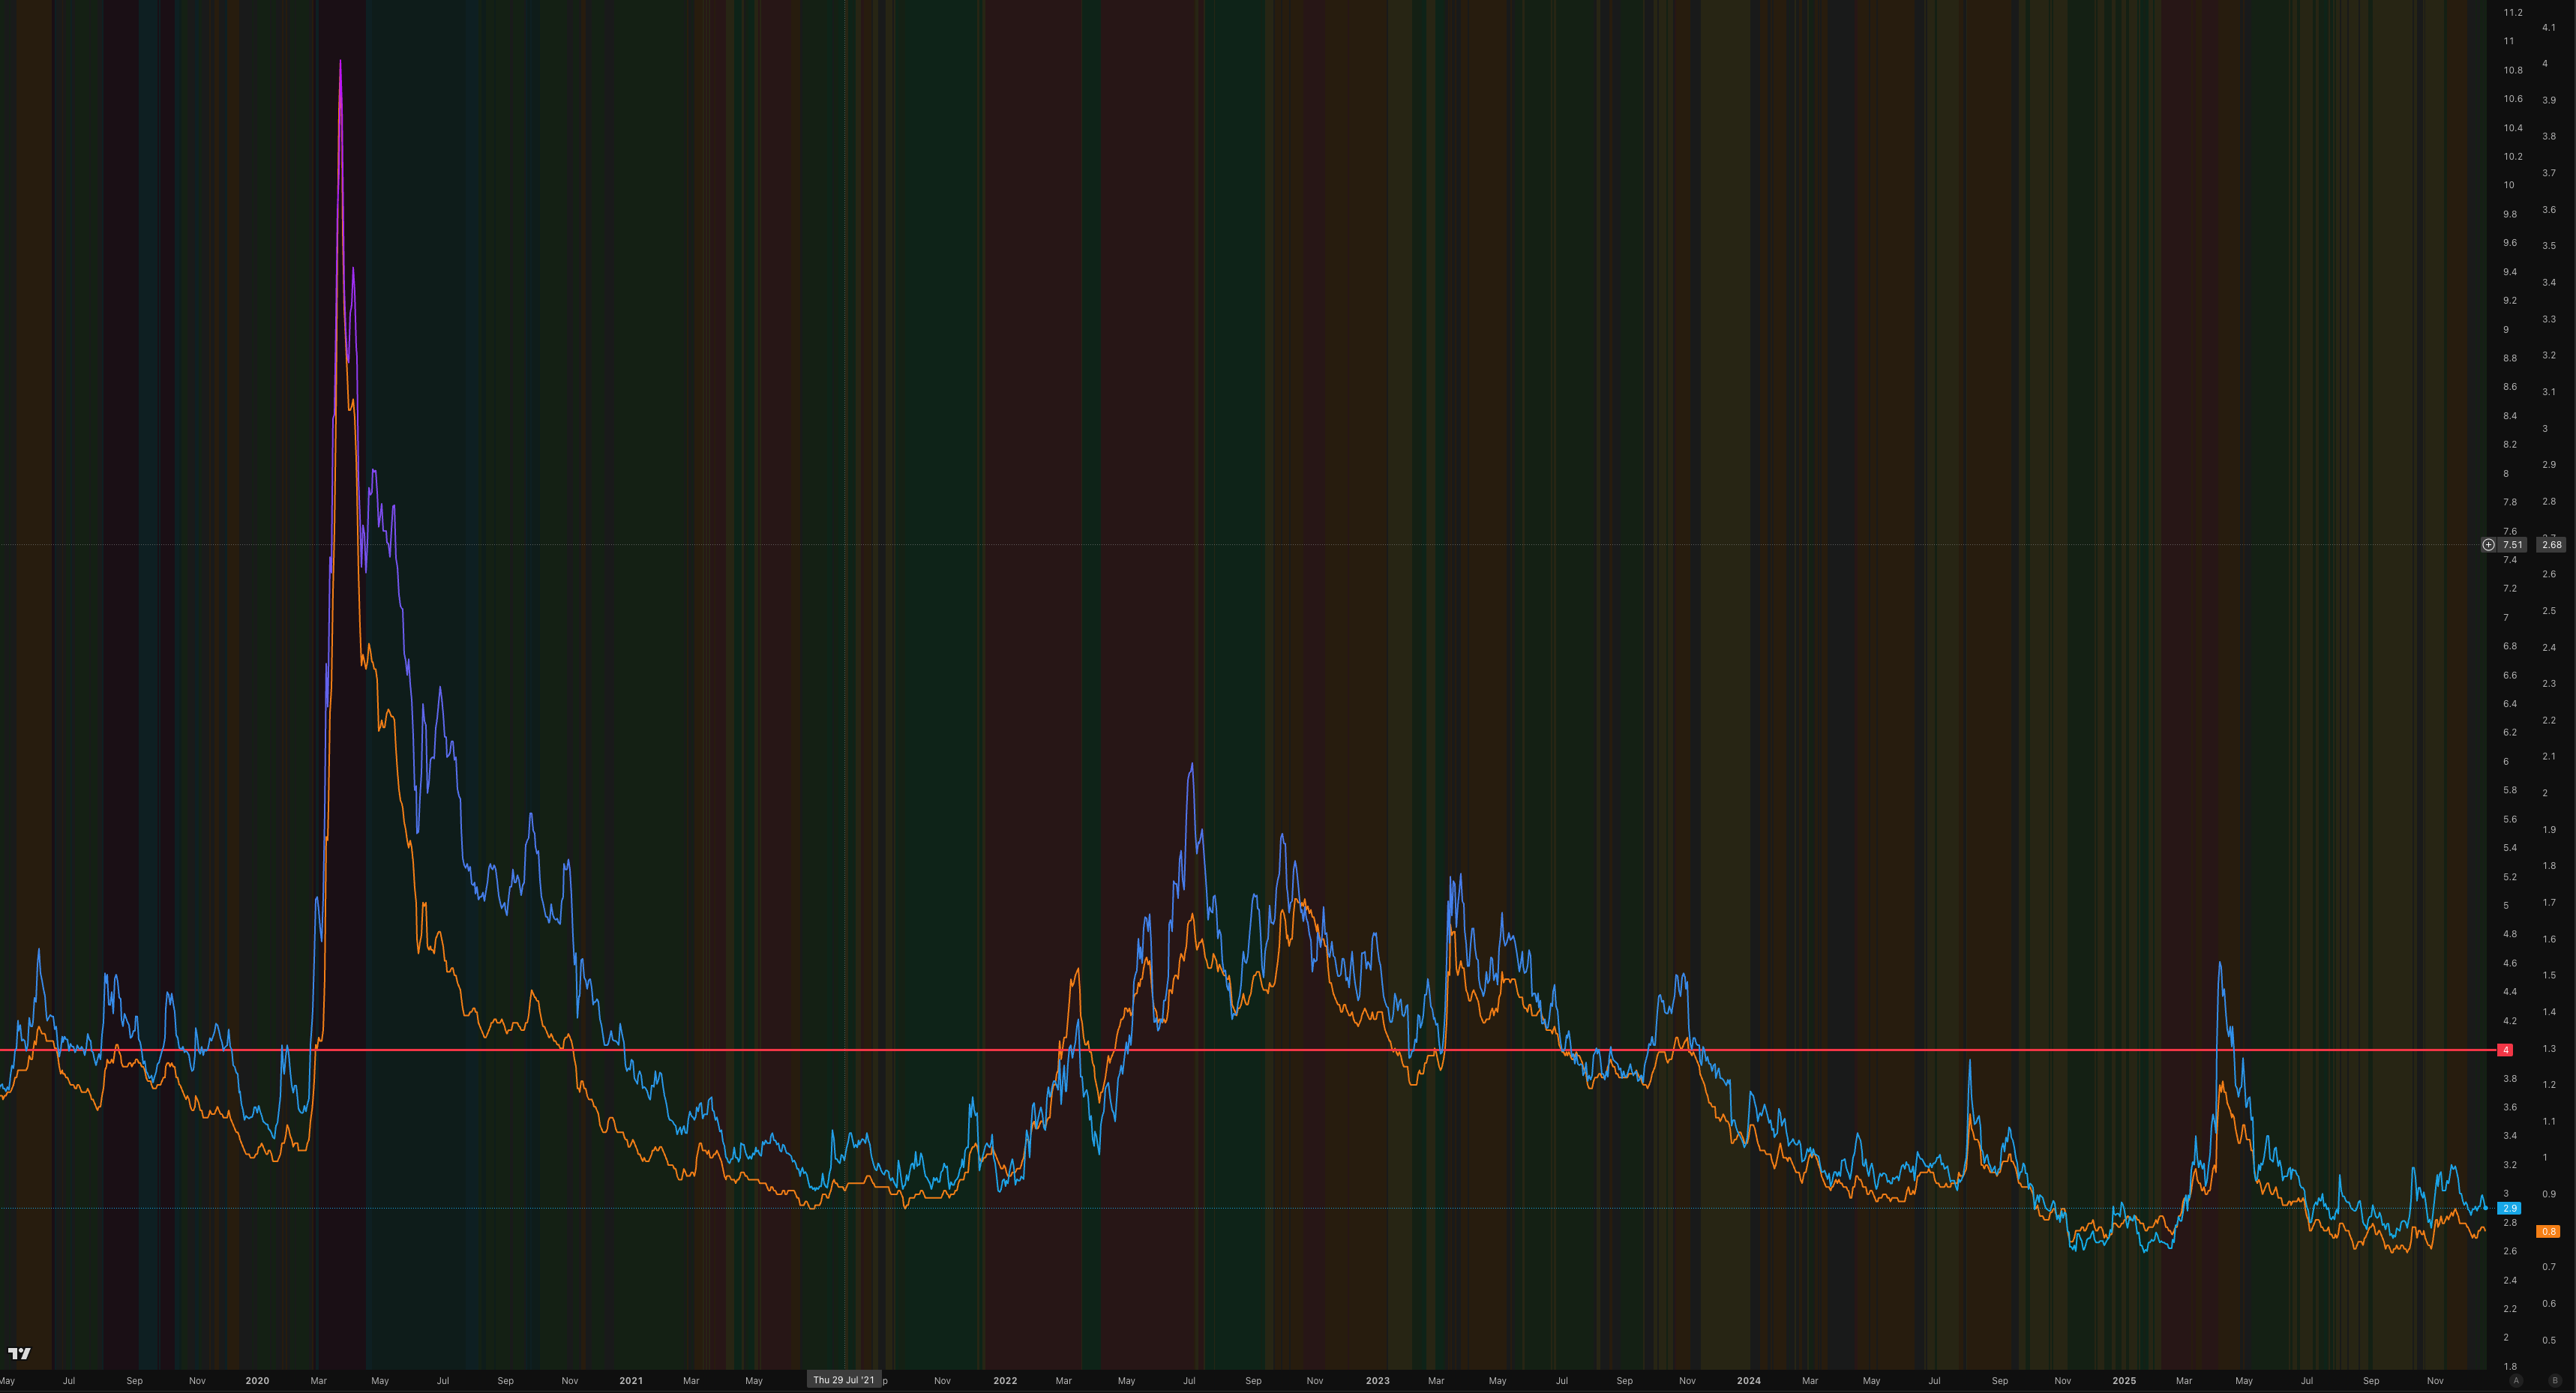
Source: FRED Series BAMLH0A0HYM2 — ICE BofA US High Yield OAS (https://fred.stlouisfed.org/series/BAMLH0A0HYM2). IG: FRED BAMLC0A0CM (https://fred.stlouisfed.org/series/BAMLC0A0CM).
Already triggered: 2s10s curve uninverted to +67bp (historically confirms recession, timing varies). Overnight RRP drained to zero (liquidity buffer exhausted). VIX below 15 (complacency amid warning signals).
Growth signposts to watch:
ISM Services is the key - above 52 keeps soft landing alive, below 50 confirms hard landing.
ISM Manufacturing crossing back above 50 would be genuinely bullish. Initial claims breaking above 275k would be concerning.
The current uptick to 217,500 demands attention, though the four-week moving average remains historically low and has shown week-to-week volatility - direction matters more than any single print.
Inflation signposts to watch:
Core PCE dropping to 2.5% confirms the CPI improvement and softens the Stagflation classification. Breaking above 3.0% signals no landing.
The CPI/PCE divergence should resolvem watch which one is leading.
Risk signposts to watch:
HY spreads above 400 basis points would confirm recession signal, currently at 285-290bp, a long way from stress.
VIX sustained above 25 means the complacency has cleared and markets are pricing risk appropriately. Paradoxically, that would make the setup more investable.
The Bottom Line
We’re ending 2025 with the dashboard in Stagflation territory - growth negative, inflation mixed but still elevated on PCE, three signposts triggered. That’s the framework output.
But frameworks have limitations. The bull case - services holding at 52.6, CPI improving sharply, AI and fiscal tailwinds, credit calm, accommodative policy - is legitimate. The signposts have given false positives before. Markets could be right and the indicators wrong. The VIX below 15 might be reading something the others are missing.
The soft landing probability has come down from 55-60% to 45-50% - still the base case, but no longer a comfortable edge. The hard landing probability has risen to 30-35%. Four triggered signposts demand respect, even if they don’t demand panic.
Here’s how I’m thinking about it:
The cycle has taken us from pandemic panic to inflation crisis to tightening regime to soft landing hopes to… this. Stagflation on the dashboard, complacency in the markets. We’ve navigated every chapter so far. But the story isn’t over. The next chapter—whether the signposts prove prescient or premature—will be written by the data in the months ahead.
The framework is ready. The signposts are flashing. Now we watch.
See you January 4th for The Setup.
The Breakdown is published monthly. For the weekly regime framework and cross-asset positioning, The Setup publishes every Sunday evening. If something material shifts mid-week, you’ll hear from me via The Pulse.
Coming in January: The Debrief. Monthly accountability, tracking what worked, what didn’t, and how the framework is evolving. If I’m asking you to trust the regime signals, you deserve to see the receipts. First issue drops end of January, covering the journey so far from Goldilocks to Stagflation.
Questions or feedback? Drop me a line at macroanalytix.research@gmail.com
Disclaimer
All content published by MacroAnalytix is for research and educational purposes only. Nothing on this site or in our publications should be interpreted as financial advice, investment recommendations, or a solicitation to buy or sell securities.
You are solely responsible for your own financial decisions. Please conduct your own due diligence and consult with a licensed financial professional before making any investment decisions.
Past performance is not indicative of future results. All investments involve risk, including potential loss of principal. The views expressed herein are those of the author as of the date of publication and are subject to change without notice.