

Executive Summary
The Regime Transition
Six weeks ago, MacroAnalytix launched with a dashboard flashing Reflation. Four weeks later, we were staring at Stagflation - four signposts triggered simultaneously, the worst regime in the framework. Two weeks after that, we’re somewhere entirely different: the center of the matrix, directionless, with minimal conviction and a completely different set of warning signals.
The journey from The Setup Issue #001 to Issue #005 tells the story of why regime-based thinking matters. If you traded the Stagflation headlines, you got whipsawed. If you followed the dashboard’s systematic approach, you navigated the volatility without major damage.
This issue maps where we are now, why we got here, and most importantly, what Q1 2026 is likely to bring. Not predictions with false precision, but probability-weighted scenarios built from the same framework that caught the regime transitions in real time.
Where We Stand: The Current Regime
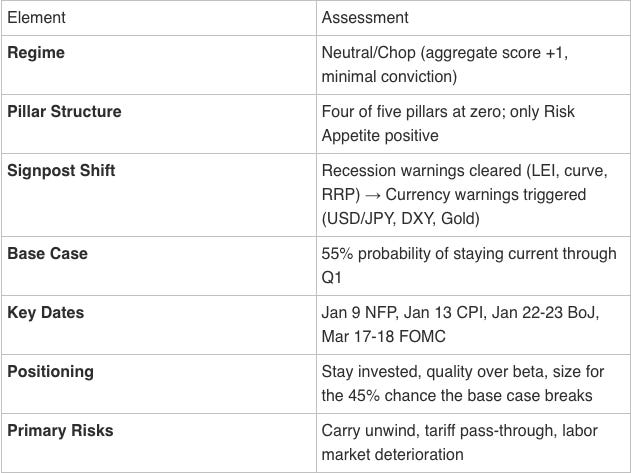
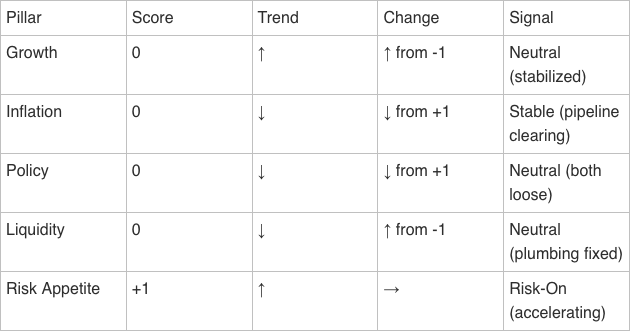
The dashboard reads directionless - aggregate score of +1, minimal conviction. Four of five pillars score at zero. Only Risk Appetite is positive, and it’s carrying the entire regime read. That’s a fragile structure.
Current Regime: Neutral/Chop | Aggregate Score: +1 | Conviction: Minimal
The “Minimal” conviction flag isn’t uncertainty about the data, it’s a statement that the data itself is directionless. Growth has stabilized but isn’t accelerating. Inflation is clearing the pipeline but hasn’t reached target. Policy is loose but not easing further. Liquidity is normalized but not supportive. When every pillar sits at zero, the regime matrix places you in the center: no clear winning theme, no clear losing theme.
That sounds like good news after the Stagflation scare. It isn’t necessarily. This regime is an unstable equilibrium. Small changes in any pillar can tip the balance in either direction. The 55% probability of staying current means 45% odds we don’t.
The Signpost Story: What Cleared, What Triggered
The signpost system is designed to flag regime-relevant extremes and conditions that historically precede transitions or dislocations. Two weeks ago, four warning signposts had triggered simultaneously. Today, three have cleared and three new ones have emerged. Understanding why tells you something important about where we’re headed.
What Cleared (And Why It Matters)
2s10s Uninversion: The yield curve had steepened to +68 basis points from its inverted lows, triggering the historical “recession confirmation” signal. The aggressive steepening has moderated. The curve isn’t screaming anything right now.
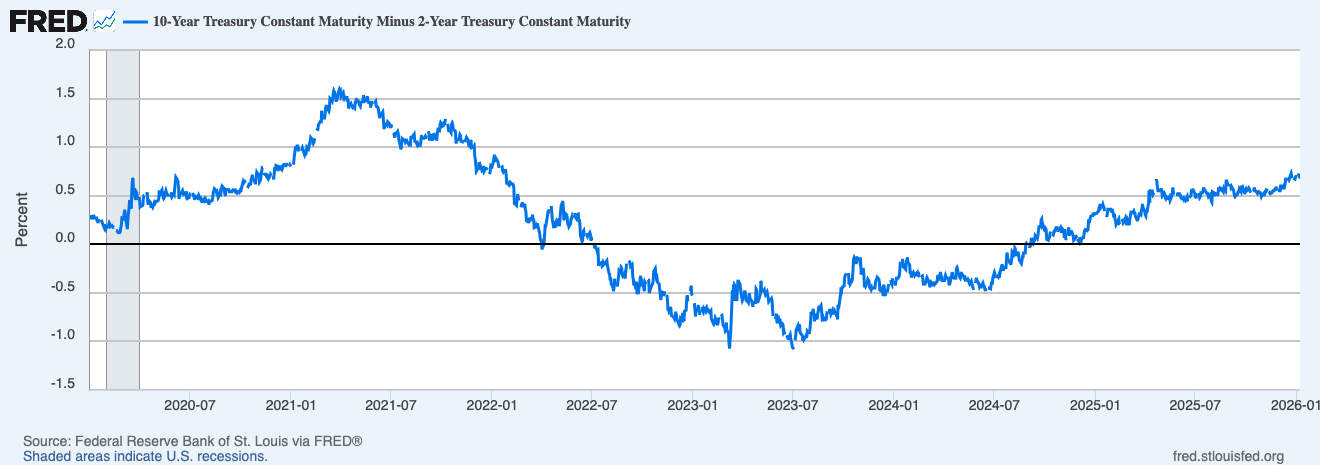
Source: https://fred.stlouisfed.org/series/T10Y2Y#
RRP Buffer Exhausted: The overnight reverse repo facility had been completely drained to zero, removing the system’s shock absorber. It’s recovered from zero to $106 billion and back down again. Pre-2022 levels were in the trillions. The anticipated year-end squeeze didn’t materialize. The Fed’s T-bill buying program worked.
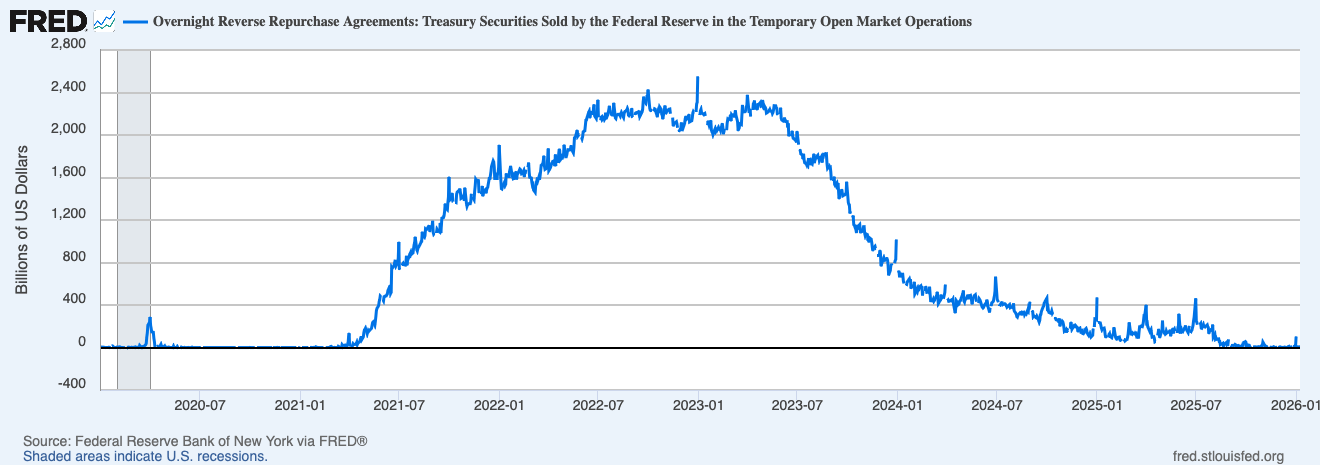
Source: https://fred.stlouisfed.org/series/RRPONTSYD#
What Triggered (And Why It Matters)
USD/JPY Above 152 (Current: 154.2): This is the carry trade warning. At these levels, the yen is near its weakest point against the dollar in decades. The Bank of Japan intervened in 2022 and 2024 when USD/JPY reached similar extremes. When the yen reverses, it reverses violently and global macro funds running carry trades get forced to unwind, the cascade hits risk assets regardless of fundamentals.
August 2024 gave us the preview: EEM dropped 8% in three sessions, with high-yielding EM currencies (MXN, BRL, ZAR) hit hardest as funding costs spiked. The signpost doesn’t say “sell everything” - it says “be aware of the tail risk.”
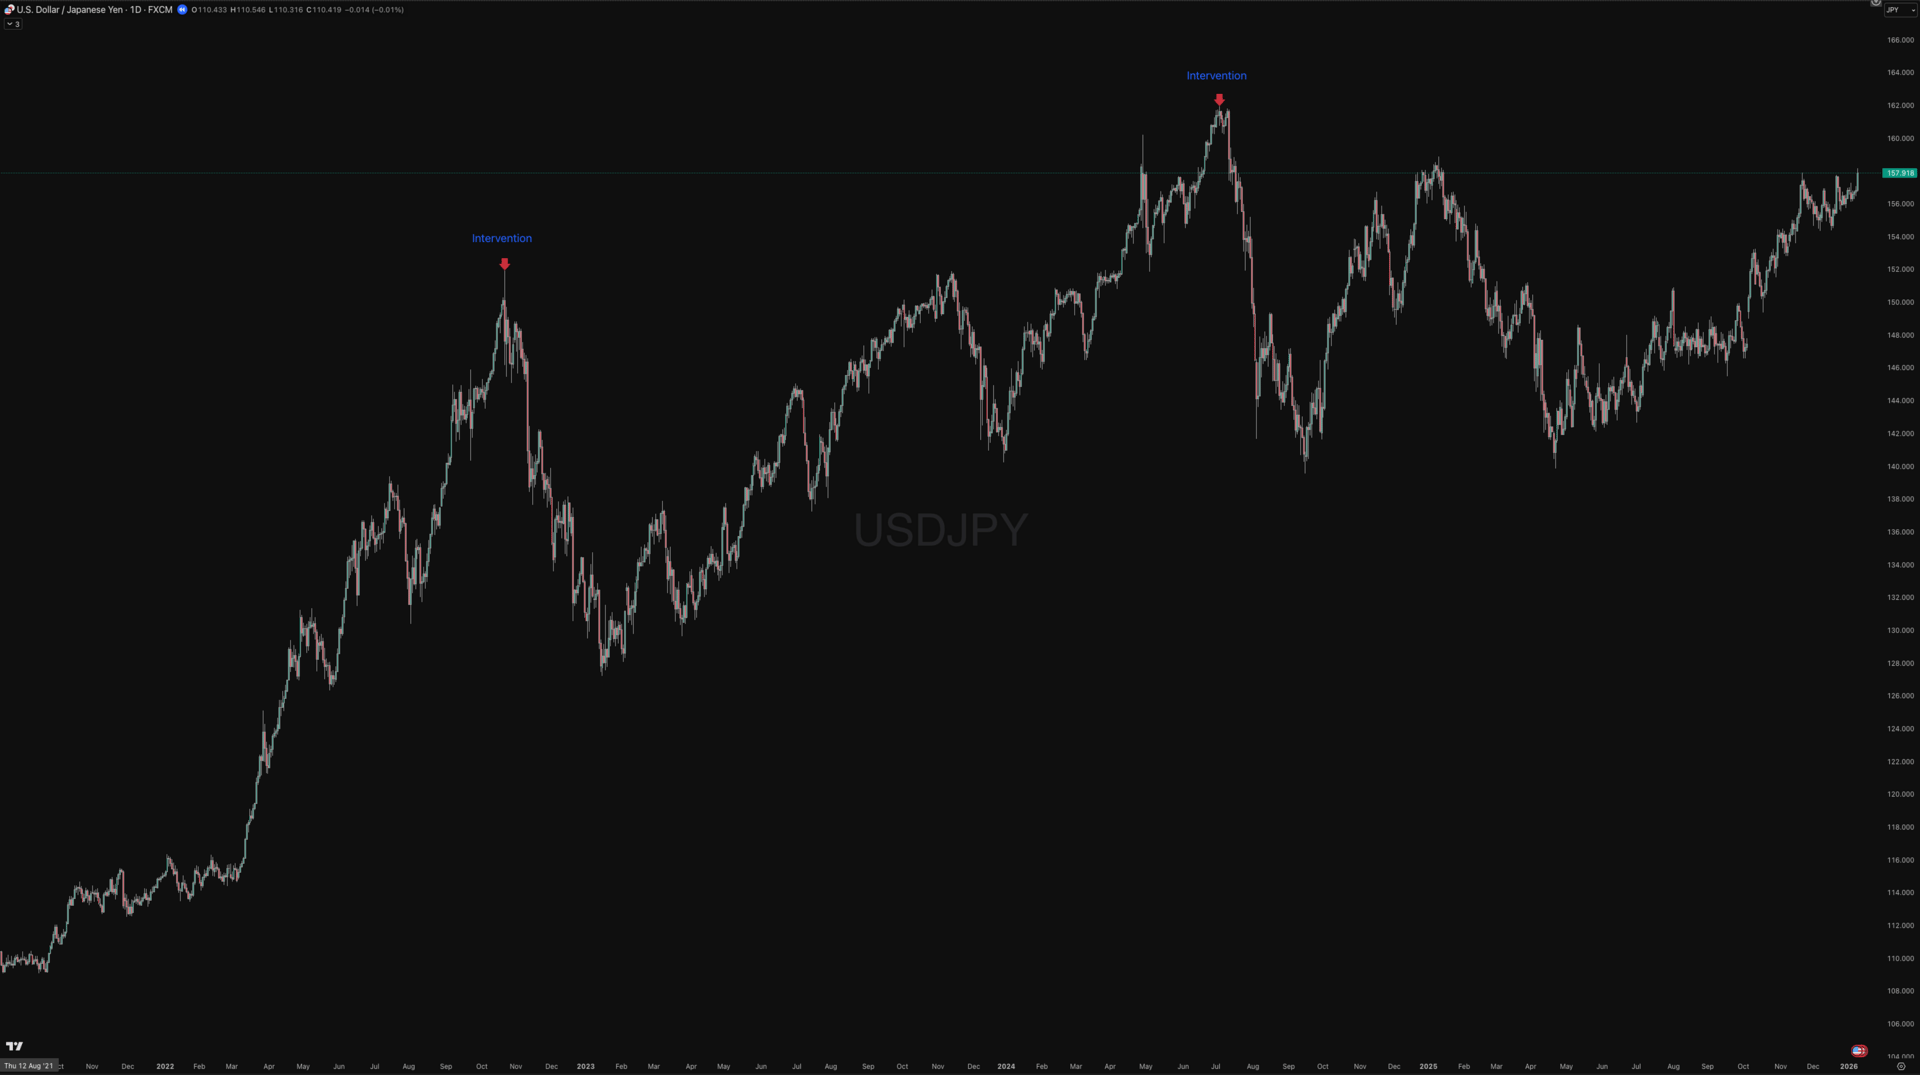
Source - TradingView - USD JPY with BoJ intervention points
DXY Below 100 (Current: 98.4): The dollar has broken below the psychological 100 level on the DXY index. Part of this is mechanical: the Fed has cut while the ECB holds, compressing rate differentials that had supported dollar strength. But the move goes beyond rate spreads.
Dollar weakness is typically risk-on, it eases global financial conditions, supports EM and commodities, reflects capital flowing out of safe-haven assets. Combined with the gold signpost, it tells a different story: not “risk-on” but “dollar devaluation concerns.” The BIS 2024 Triennial Survey noted a 3 percentage point decline in dollar share of FX reserves since 2020, gradual, but directionally significant.
GLD Above $300 (Current: $398): Gold continues its structural rally, now trading well above traditional fair value models. The old relationship with real rates has broken, or rather, it’s been overwhelmed by central bank reserve reallocation.
China added 225 tonnes in 2024, with Poland, Turkey, and India each adding 50-100 tonnes. The pace has continued into 2025 and preliminary data suggests another 150+ tonnes of net CB purchases in H2 alone. That’s not speculative positioning more reserve diversification.
The Pattern: The cleared signposts were about recession risk. The triggered signposts are about currency and carry risk. We’ve moved from “is the economy about to crack?” to “are currency relationships about to reset?” Different risk, different implications.
Q1 2026: The Probability-Weighted Scenarios
The dashboard’s transition probability matrix generates systematic estimates for where the regime is heading. These aren’t predictions, they’re probability-weighted scenarios based on score velocity, historical patterns, and current catalyst positioning.
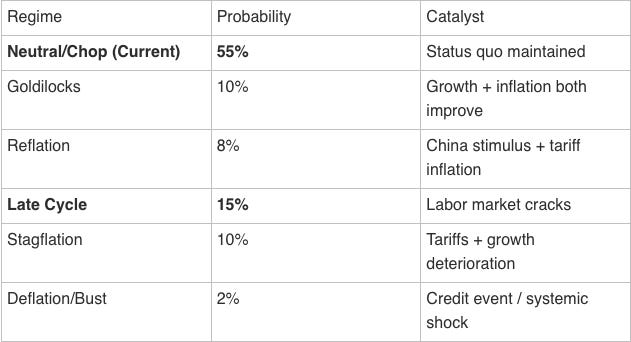
Base Case: Neutral/Chop Persists (55%)
Why only 55% when three recession signposts just cleared? Because clearing signals isn’t the same as confirming strength. The LEI flipped positive, but at +0.3%, barely. The curve uninverted, but that’s historically a lagging confirmation, not an all-clear. The RRP recovered, but is now down from $106B to $3B again, not the trillions that provided cushion pre-2022. Meanwhile, three new currency signposts triggered, and the growth pillar sits at zero. The recession risk receded; the expansion case didn’t strengthen. That’s why the base case is ‘muddle through,’ not ‘breakout.’
The most likely outcome is that nothing decisive happens. Growth stabilizes around current levels. Inflation continues its slow grind toward target. The Fed stays on hold. Liquidity conditions remain adequate. Markets chop sideways with occasional volatility spikes.
Bull Case: Soft Landing Confirmed (18%)
Path to Goldilocks (10%): Requires both growth and inflation to move in the right direction simultaneously. Growth stabilizes or improves while inflation continues declining toward 2%. The Fed validates with dovish guidance. Credit stays tight. Equities break to new highs on fundamental rather than liquidity grounds.
Path to Reflation (8%): Requires growth to accelerate while inflation stays contained. China is the swing factor here. The stimulus announced in late 2024, rate cuts, property support, local government debt swaps have started showing up in the data: Caixin PMI crossed back above 50, FXI is up 15% off the lows, and the Yuan has stabilized. But ‘showing up’ isn’t the same as ‘working.’ Property sales remain weak, consumer confidence is still depressed, and the demographic headwinds are structural.
The question is whether this is 2016 (stimulus gains traction, global growth recovers) or 2023 (stimulus disappoints, copper rolls over). The copper/gold ratio will tell you before the headlines do.
Bear Case: Late Cycle or Worse (27%)
Path to Late Cycle (15%): Runs through the labor market. The NFP 3-month average at 59k is already soft. If January and February confirm that weakness - payrolls below 100k, unemployment ticking above 4.3% - the growth pillar flips negative and we’re back in familiar territory. Services rolling over (ISM below 50) would accelerate the transition.
Path to Stagflation (10%): Requires both growth deterioration and inflation reacceleration. Tariffs are the obvious catalyst, but they’re not the only one. Energy transition costs are structural; grid upgrades, permitting delays, and intermittency premiums add persistent price pressure that doesn’t respond to Fed policy. AI-driven productivity gains could eventually be disinflationary, but the near-term capex surge is inflationary - $200B+ in data center buildouts competing for the same electricians, copper, and power capacity.
The tariff pass-through timeline matters: Consumer goods (electronics, apparel, furniture): Hit retail prices within 3-6 months, that’s the Q2 CPI risk. Industrial intermediates (steel, aluminum, components): Take 6-12 months to flow through, showing up in capital goods and construction costs by H2.
If both layers land simultaneously, the pipeline model would show upstream pressure rebuilding while downstream persistent services inflation stays elevated. That’s the toxic combination.
Path to Deflation/Bust (2%): Requires a credit event or systemic shock. HY spreads breaking above 400 bps. A funding market dislocation that the Fed doesn’t contain quickly enough. The carry unwind cascading beyond FX into broader risk assets.
Two underappreciated catalysts: AI capex disappointment: if the $200B+ buildout fails to generate returns, the Mag 7 names that have carried the market could gap lower, taking passive flows with them. Debt ceiling: with midterms approaching and neither party wanting to blink, a messy resolution in Q1-Q2 could spike Treasury yields and stress funding markets simultaneously.
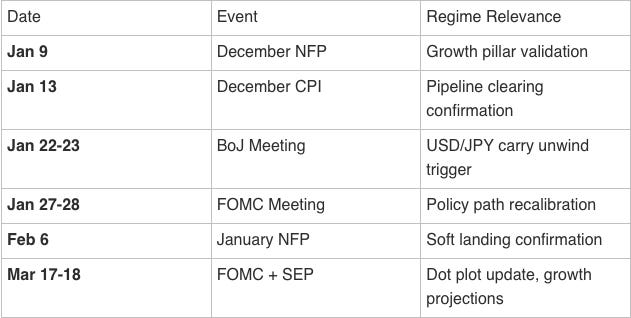
The Q1 Catalyst Calendar
Regimes don’t shift in a vacuum. They shift when data confirms or contradicts the current consensus. Here are the dates that matter for Q1 and what each event could mean for the regime.
The Three Weeks That Matter Most
January 9-13: The Data Gauntlet
December NFP (Jan 9) followed by December CPI (Jan 13). This window will either confirm the soft landing narrative or challenge it.
• Strong jobs + cooling inflation = Goldilocks path opens
• Weak jobs + persistent inflation = Late Cycle path opens
January 22-23: The BoJ Wildcard
The Bank of Japan meets with USD/JPY at multi-decade extremes. If they signal rate hikes or intervene in the currency market, the carry unwind risk materializes. August 2024 showed how quickly this can cascade, the yen strengthened 12% in three weeks, forcing global position liquidation. Watch for any hawkish language around exchange rate concerns.
March 18-19: The Fed Check-In
The March FOMC brings the Summary of Economic Projections update. By then, we’ll have more data and hopefully more clarity. The dot plot revision will tell us whether the Fed sees the same economy we’re seeing,or something different.
• Dovish shift (more cuts projected) validates Late Cycle concerns
• Holding steady (one cut) validates the current directionless regime
• Hawkish shift (no cuts or rate hikes mentioned) would be a significant surprise
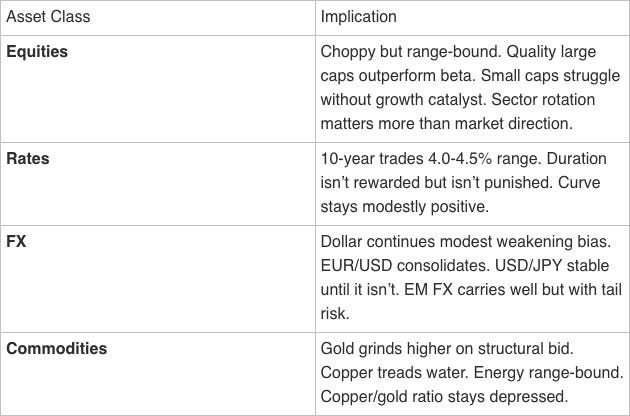
Cross-Asset Implications by Scenario
If the Current Regime Holds (55%)
If Soft Landing Confirms (18%)

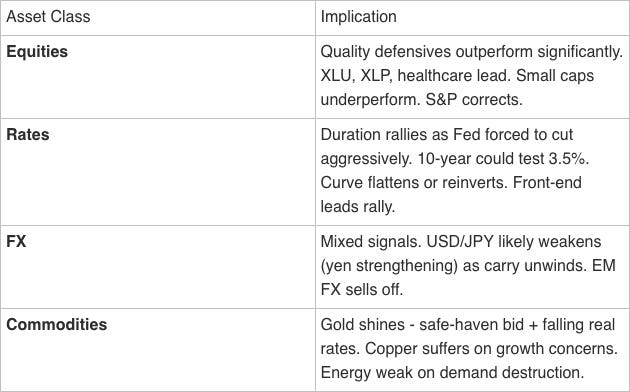
If Late Cycle/Stagflation Materializes (27%)
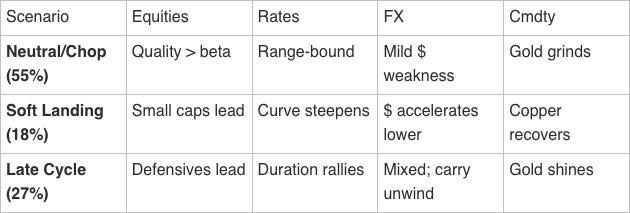
Cross-Asset Quick Reference
The Honest Assessment
I’ll close with what I actually think, not what the probabilities say, but my subjective read on the situation.
The Stagflation scare was real but premature. The signposts that triggered were legitimately concerning. The curve had uninverted. The RRP buffer was exhausted. But the coincident data, services, labor, retail sales never confirmed the warnings. The leading indicators gave a false positive, or at best, an early signal that hasn’t played out yet.
The new signpost cluster worries me differently. USD/JPY, DXY, and Gold all pointing to dollar weakness and carry risk isn’t a recession warning, it’s a currency regime warning. When the safety trade (gold) and the risk trade (weak dollar) align, it’s usually telling you something structural is shifting. I don’t know exactly what that shift is.
The path to Late Cycle is shorter than the path to Goldilocks. With the Fed on pause, tariff policy uncertain, and leading indicators still soft, it’s easier to construct a scenario where things deteriorate than one where things improve. That asymmetry shapes how I’m sizing positions.
But I’ve been wrong before by underweighting the bull case. AI capex is running at $200B+ annually and accelerating, that’s real investment, real jobs, real productivity potential. The 1990s showed that productivity booms can extend cycles far longer than leading indicators suggest. Services employment remains resilient at 70% of the economy. And the Fed has room to cut aggressively if needed, they’re not trapped at zero like 2020. The soft landing probability isn’t 55% because nothing is working; it’s 55% because enough is working to keep the expansion alive. Don’t mistake caution for conviction.
Q1 will provide clarity. The data gauntlet (NFP + CPI) in mid-January, the BoJ meeting in late January, the February NFP confirmation, the March FOMC, by the end of Q1 we’ll know whether the soft landing held, whether tariffs bit, whether the labor market cracked, whether the carry trade unwound. The fog will lift. The question is what we’ll see when it does.
Questions or feedback? macroanalytix.research@gmail.com
Disclaimer: All content published by MacroAnalytix is for research and educational purposes only. Nothing in this publication should be interpreted as financial advice, investment recommendations, or a solicitation to buy or sell securities. You are solely responsible for your own financial decisions.