

Inflation: Reading the Pipeline
Last time we covered Growth, the engine of regime classification. This time we’re tackling Inflation, the second axis of the regime matrix. Get these two right and you’ve got the fundamental picture. Growth up + inflation down = Goldilocks. Growth down + inflation up = Stagflation. Obviously liquidity and policy play a part but you get the picture.
But here’s the thing I wish someone had told me years ago: by the time inflation shows up in the CPI print, the trade is already stale. You’re seeing where prices were, not where they’re going. Everyone’s watching the same number, reacting to the same headlines, trading the same information. There’s no edge in that.
The edge (if there is one) comes from understanding inflation as a process, not a number. A pipeline with stages. Pressures that build upstream, flow through expectations and eventually show up in the sticky prices the Fed actually targets. If you can read the pipeline, you can see the regime shift before CPI day confirms it.
This took me longer to figure out than the growth framework and I’m still learning, but let me walk you through how I think about it now.
Why Inflation Is Different From Growth
Growth has a relatively clean relationship with asset returns. Economy expands, earnings grow, risk assets do well. Economy contracts, earnings fall, defensive assets win. Cause and effect.
Inflation is messier. The relationship with returns depends entirely on why inflation is doing what it’s doing and what else is happening at the same time.
Rising inflation with strong growth? That’s Reflation, commodities rip, value beats growth, duration suffers, but equities can still work. Rising inflation with weak growth? That’s Stagflation, pretty much everything hurts except gold and maybe energy. Same inflation direction, completely different playbooks.
Falling inflation with strong growth? Goldilocks, the best environment for risk assets. Falling inflation with weak growth? Could be Deflation risk, duration wins big, but you’re also worried about credit and equity exposure.
This is why the regime framework plots Growth against Inflation as a 2x2 matrix. Neither dimension alone tells you enough. You need both to know which playbook to run.
But it also means inflation analysis has to work differently than growth analysis. You’re not just asking “is inflation going up or down?” You’re asking “where are the pressures, how persistent are they, and what’s the interaction with the growth picture?” That requires understanding the mechanics in a way that pure growth analysis doesn’t.
The Mental Model That Changed How I Think About This
For years I tracked CPI and PCE like everyone else. Month comes out, number goes up or down, I update my view.
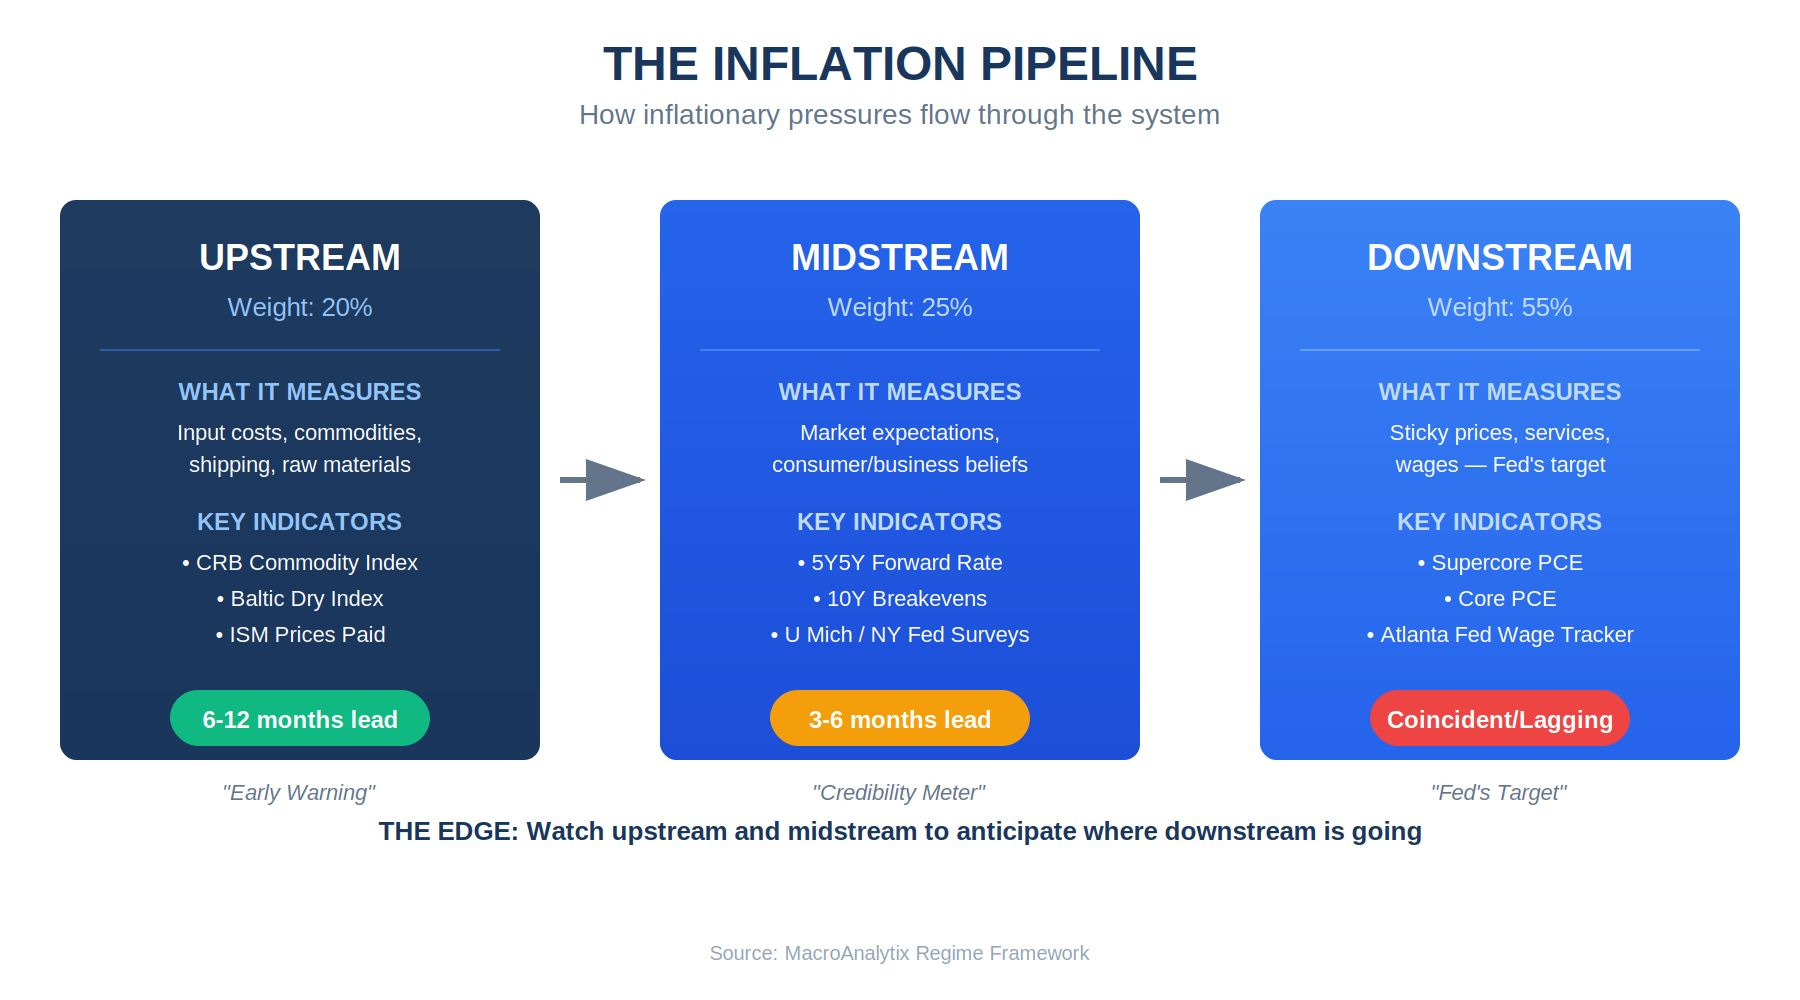
The breakthrough and I really do mean breakthrough, this was a genuine level-up in how I think, came when I started conceptualizing inflation as a pipeline with three stages.
Stage 1: Upstream. Input costs, commodity prices, shipping rates. This is where inflationary pressure enters the system. Raw materials, energy, transportation. The stuff that flows into everything else. When upstream is building pressure, it’s going to show up downstream eventually.
Stage 2: Midstream. Expectations. What bond markets, businesses and consumers believe inflation will be. This matters because expectations influence behavior. Wage demands, pricing decisions, spending patterns. If expectations de-anchor, transitory inflation can become permanent.
Stage 3: Downstream. The sticky prices consumers actually pay. Services, wages, rent. This is what the Fed targets and what CPI/PCE measure. By the time pressure shows up here, it’s already flowed through the first two stages. That’s why downstream is coincident or lagging, it confirms where you are, not where you’re going.
The power of this model is pattern recognition. Different combinations tell you different stories:
All three stages falling? Pipeline clearing - disinflation is coming, duration looks attractive.
Upstream rising but downstream stable? Pressure building - prepare to reduce duration before the CPI prints confirm it.
Upstream falling but downstream sticky? Normal lag - be patient, don’t overreact to current levels, the clearing is coming.
All three rising? Full pipeline pressure - Stagflation risk is real, get defensive.
Midstream de-anchoring while upstream is stable? That’s a credibility problem, the Fed has to act regardless of current inflation levels.
The framework gives you a bigger picture than any single number and it gives you lead time, which is the whole point.
Upstream: Where Inflation Begins
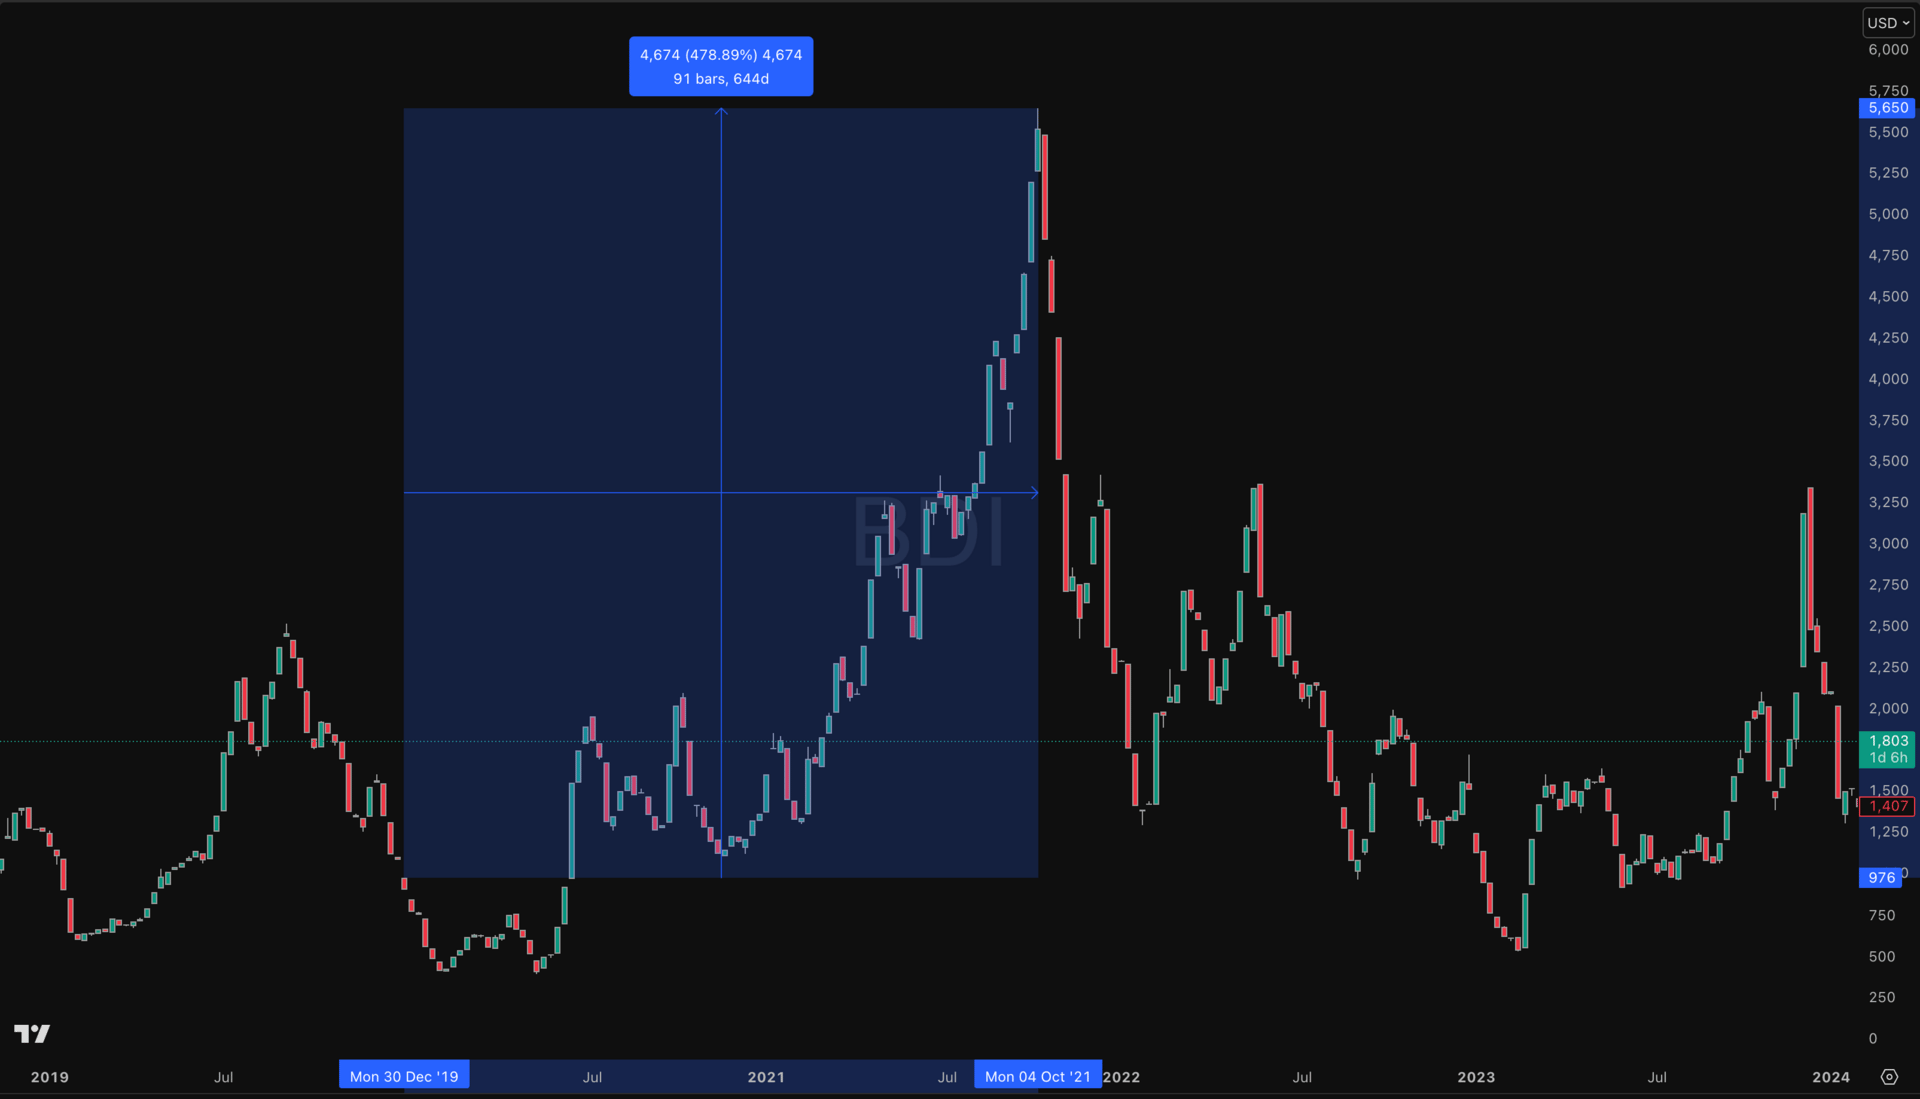
Inflationary pressures almost always start upstream. Commodity price spikes, shipping cost surges, supply chain disruptions, these are the first dominoes. By the time they show up in consumer prices, you’ve had months of warning if you were paying attention.
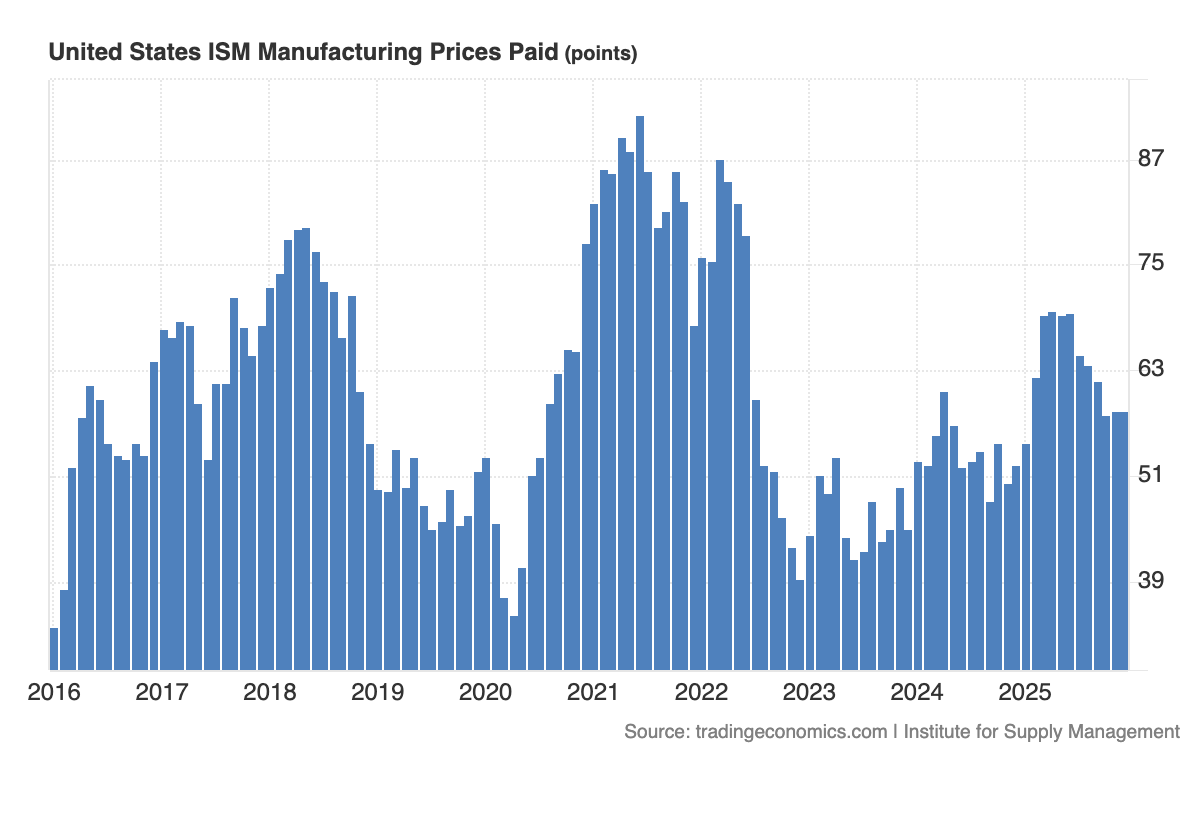
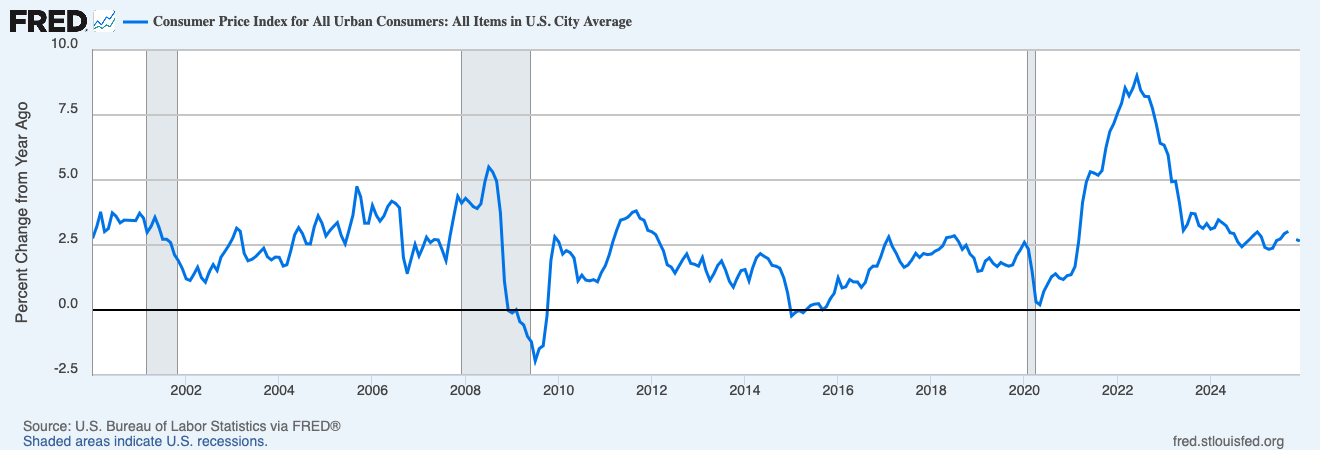
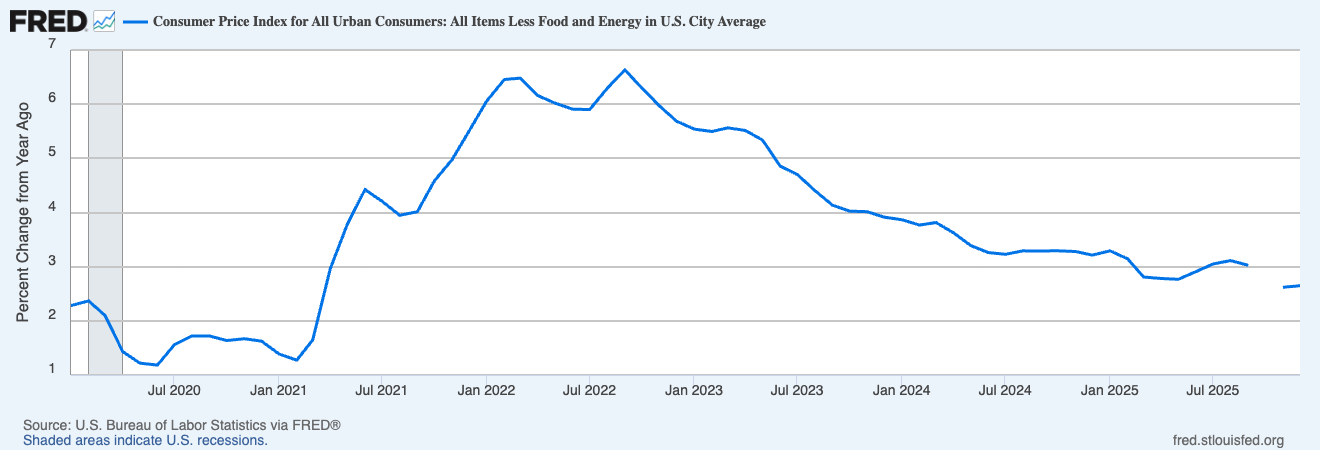
The 2021-22 inflation surge is the perfect example. The Baltic Dry Index, which measures shipping costs for bulk cargo went from around 1,000 in early 2020 to over 5,600 by late 2021. A 460% increase. ISM Prices Paid hit 92.1 in June 2021, the highest reading in decades. Anyone watching upstream saw the wave coming.
Source: https://fred.stlouisfed.org/series/PPIFIS/#
Source: https://fred.stlouisfed.org/series/CPIAUCSL#
Core CPI didn't peak until August 2022, a full 12 months later. The pipeline told the story first. If you waited for CPI confirmation, you were late.
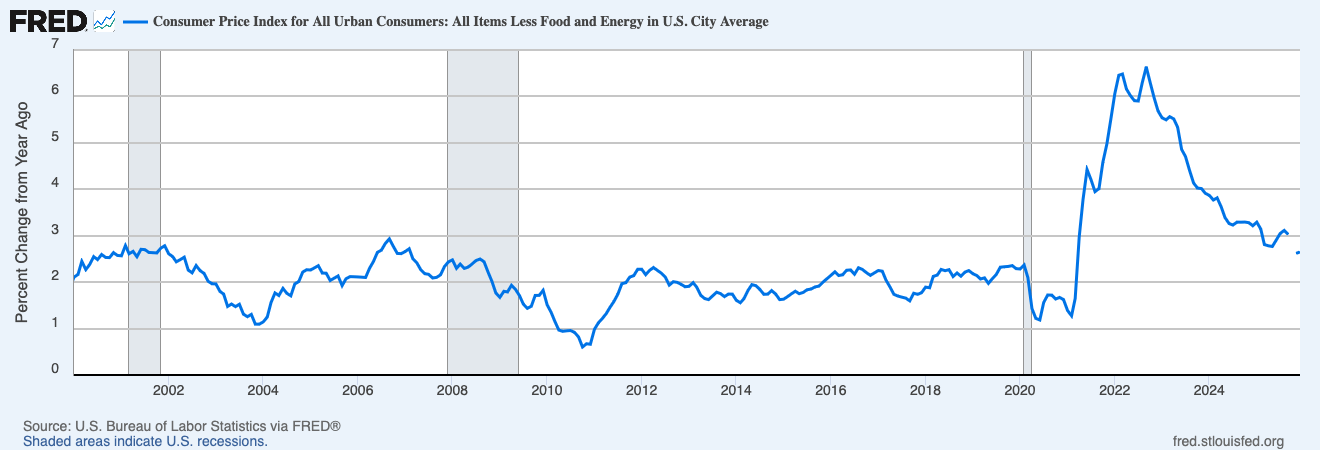
Source: https://fred.stlouisfed.org/series/CPILFESL/#
Types of Upstream Indicators
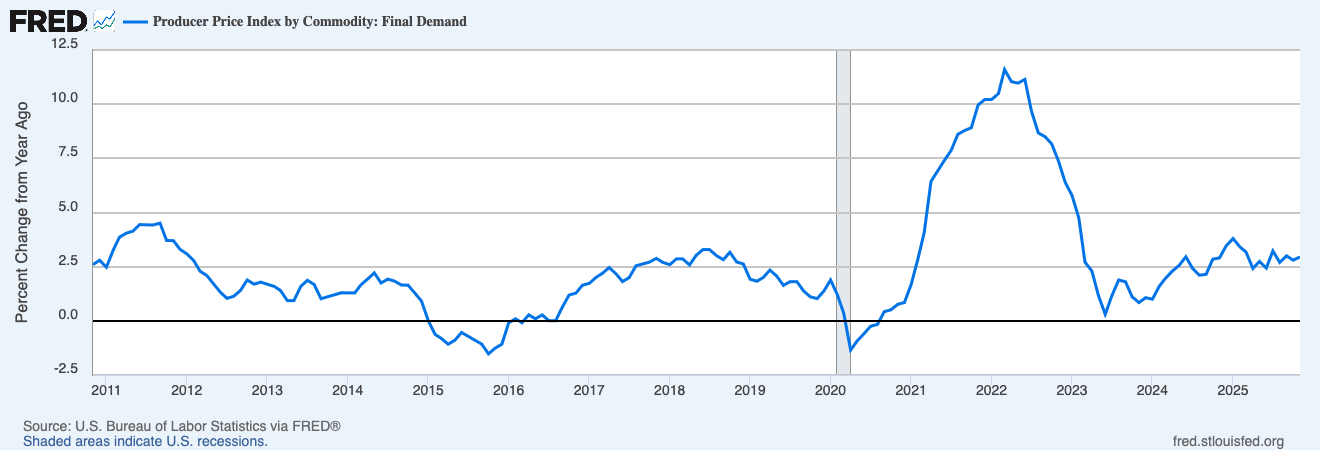
Commodity indices: Broad baskets tracking energy, grains, metals, and softs. When commodity indices are accelerating, input costs are rising across the board. The level matters less than the trend and acceleration.
Shipping and logistics costs: Indices measuring freight rates for bulk cargo, container shipping and air freight. These can’t be stored or speculated on easily, they reflect real-time supply/demand for global trade. A collapsing shipping index tells you goods inflation is softening at the source. A surging one tells you pressure is building.
Business input cost surveys: What businesses are actually paying for inputs. Manufacturing surveys often include a ‘prices paid’ component that captures the pass-through from commodity markets to business costs. Readings above historical averages signal pressure; readings below signal relief.
I weight upstream at about 20% of the inflation pillar. It’s leading, so it gets less weight than the stuff the Fed actually targets. But it’s the early warning system.
One thing worth noting: upstream isn’t just a US story. Global commodity markets and shipping routes mean that China’s slowdown, European energy dynamics and emerging market demand all feed into the same pipeline. Shipping indices don’t care where the cargo is headed, they measure global trade flows. When China’s property sector struggles and construction demand falls, that shows up in copper and iron ore prices that eventually hit US input costs. When European natural gas spikes, it ripples through global energy markets. The upstream indicators are inherently international, which is part of what makes them useful as early warning signals.
Midstream: The Credibility Meter
This is the probably the toughest one to get right because the expectations are self-fulling. If businesses expect higher inflation, they raise prices preemptively. If workers expect higher inflation, they demand higher wages. If consumers expect higher prices, they pull forward spending, increasing demand. The expectation creates the reality.
This is why the Fed talks about expectations so obsessively. They can tolerate above-target inflation if expectations stay anchored, it’s seen as temporary, a blip that will pass. But once expectations change so does the math. Transitory becomes permanent. The Fed has to break and that usually means inflicting economic pain.
Types of Midstream Indicators
Long-term market expectations: Bond market measures of what inflation will average over the next 5-10 years. These are slow-moving but powerful. When long-term expectations stay near 2%, the Fed has credibility. When they drift materially above or below that anchor, something has shifted.
Breakeven inflation rates: The difference between nominal and inflation-protected bond yields. More volatile than long-term forwards but more responsive to near-term outlook changes. Useful for gauging how the market is pricing inflation risk over the next 5-10 years.
Consumer and business surveys: What households and firms expect inflation to be over the next 1-5 years. The Fed watches these because expectations can become self-fulfilling through wage demands and pricing decisions. Short-term measures (1-year ahead) are volatile and noisy; longer-term measures (3-5 years) are more stable and more useful. Right now there’s often a divergence worth noting: 1-year expectations tend to run higher, reflecting recent price memory, while 5-year expectations sit lower suggesting people believe the Fed will ultimately get inflation under control. That gap is actually healthy. It’s when longer-term expectations start drifting toward the short-term read that the Fed gets nervous.
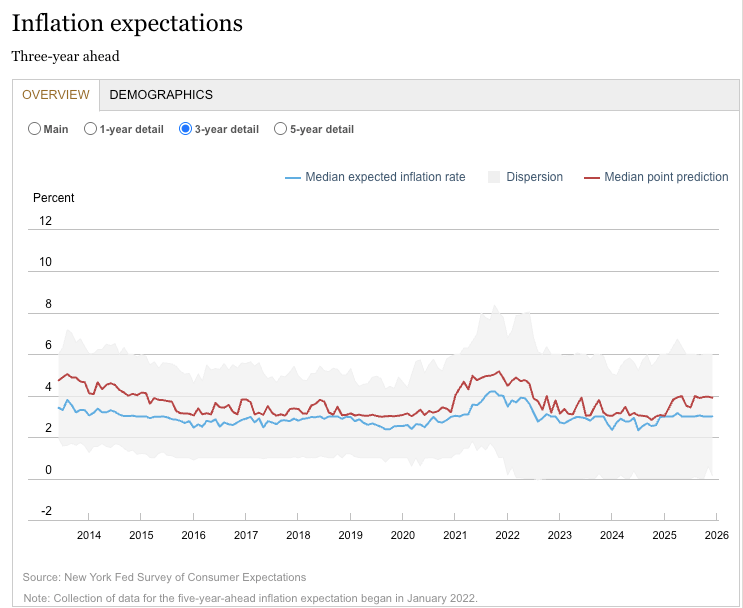
Source: https://www.newyorkfed.org/microeconomics/sce#/inflexp-3 - 3y Expectations
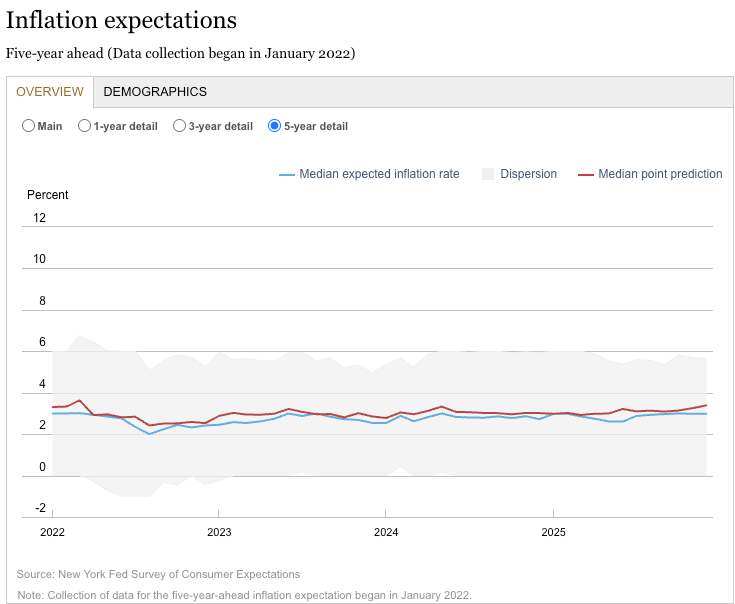
Source: https://www.newyorkfed.org/microeconomics/sce#/inflexp-4 - 5y Expectations
I weight midstream at about 25% of the inflation pillar. It's the credibility check more than anything, as long as expectations stay anchored, the Fed has room to maneuver.
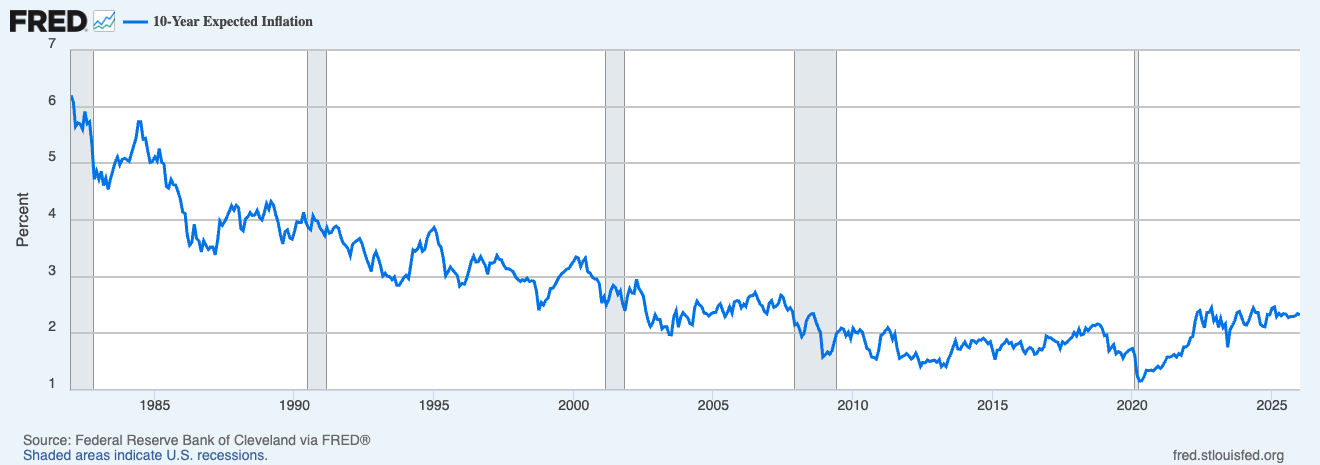
Source: https://fred.stlouisfed.org/series/EXPINF10YR
Downstream: What Actually Matters to the Fed
This is ultimately the end point. The sticky prices consumers pay. The stuff that doesn’t go away on its own. I weight downstream at 55% of the inflation pillar, more than upstream and midstream combined because this is what drives monetary policy. The Fed doesn’t target commodity prices or breakevens directly. They target PCE inflation.
Types of Downstream Indicators
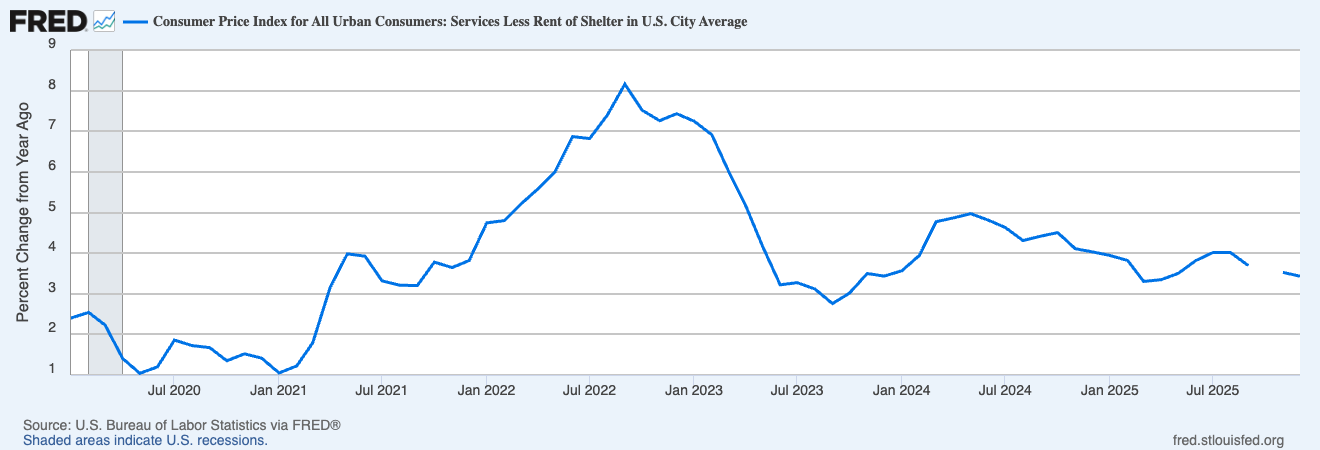
Services inflation ex-shelter: This is arguably the indicator central bankers watch most closely. Strip out volatile goods and housing, which has its own dynamics. What’s left is the most persistent inflation. The stuff that requires actual demand destruction to bring down. When this is falling, the Fed can be patient but when it’s rising, they’re behind the curve.
Core PCE: The Fed’s official target measure. Strips out food and energy to reduce volatility. The gap between current readings and the 2% target tells you how much work remains. The trend tells you whether you’re getting there.
Wage growth trackers: Wages are the ultimate sticky price. Once they go up they only grow more slowly. Look for measures that track median wage growth for continuously employed workers, removing the composition effects that distort averages. Wage growth decelerating is one of the clearest signs that the inflation cycle is turning.
Source: https://fred.stlouisfed.org/series/CUUR0000SASL2RS#
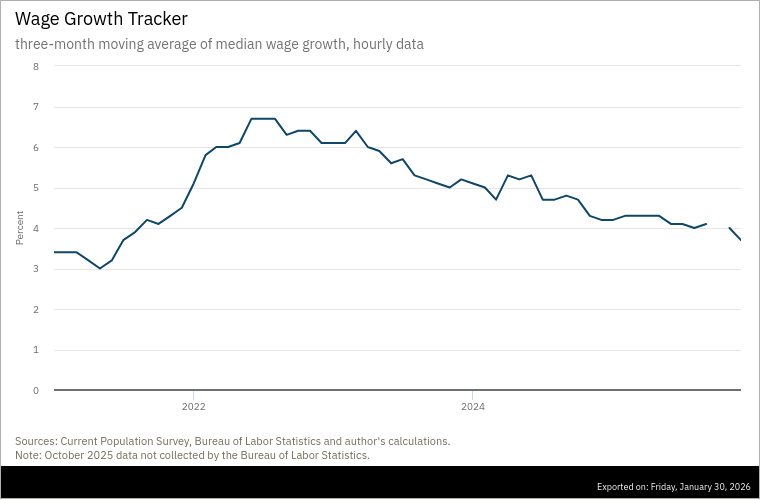
Source: https://www.atlantafed.org/chcs/wage-growth-tracker
Why PCE, Not CPI?
CPI gets all the headlines. Why does the Fed target PCE instead?
Three reasons:
Substitution effect. PCE updates its weights as spending patterns change. If beef gets expensive and people buy chicken instead, PCE adjusts. CPI uses fixed weights, so it overstates inflation when people substitute away from expensive items.
Broader coverage. PCE includes spending on your behalf, employer-paid healthcare, Medicare, Medicaid. CPI only captures out-of-pocket. Since healthcare is a huge and fast-growing spending category, PCE gives a more complete picture.
Housing treatment. Both use “owners’ equivalent rent” to measure housing costs, but they weight it differently. Housing is about 33% of CPI and 15% of PCE. When shelter inflation diverges from other components (like it has recently) this creates meaningful gaps between the two measures.
The practical implication: PCE historically runs 0.3-0.5% below CPI. So when you see a “hot” CPI print, check whether PCE confirms before freaking out. Recently we’ve seen Core CPI at 2.6% while Core PCE sits at 2.7% and the divergence is housing-driven. The Fed watches PCE.
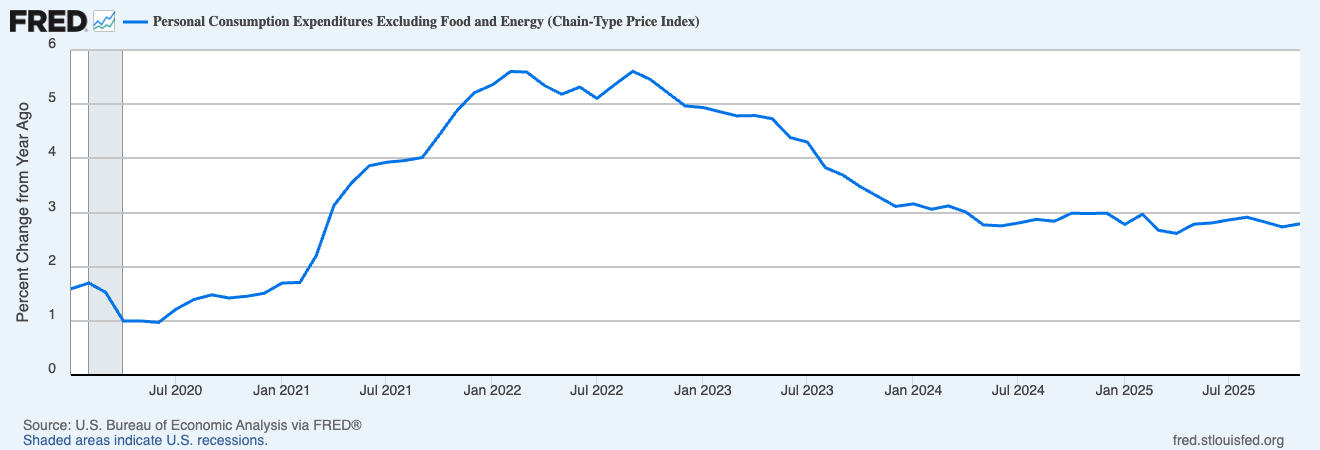
Source: https://fred.stlouisfed.org/series/PCEPILFE#
Source: https://fred.stlouisfed.org/series/CPILFESL#
Mistakes I’ve Made
The growth pillar cost me money through bad timing. Here are five more lessons I learned the hard way. You might recognise at least one from your own trading.
Reacting to CPI Day
This was my biggest inflation mistake for years. Number comes out, market moves, I’d chase and I was usually wrong by the time I’d executed.
The problem is that CPI day is already priced. The professionals trading inflation have been watching the upstream data, the regional Fed surveys, the components that print earlier in the month. By the time the headline drops, the move is often exhausted or the opposite direction from what the number “should” imply because positioning was wrong-footed.
Now I use CPI for confirmation, not initiation. If my pipeline read says disinflation and CPI confirms, I get more confident in the thesis. If CPI contradicts the pipeline read, I figure out why before changing anything.
Ignoring Services
For a long time I focused too much on goods inflation because that’s what moves around. Used cars, electronics, apparel, these components can spike 20% and then collapse. They get headlines. They feel important. Goods are roughly a quarter to a third of the basket. Services are the rest and services inflation is sticky. Wages drive services inflation, and wages don’t fall. They just grow more slowly.
During 2022-23 goods inflation collapsed as supply chains normalized. Used car prices fell 10%+. I thought inflation was solved. But services kept grinding higher. The Fed kept hiking. My trades suffered.
Now services inflation ex-housing is my single most important downstream indicator type. It’s what takes the longest to move. And it’s what tells you whether the inflation problem is actually solved or just masked by volatile components.
Confusing Level With Trend
“Core PCE at 2.7% is too high. Stay defensive.”
I was so focused on the level being above target that I missed the trend, which was clearly down. The Fed saw the trend too.
The regime framework cares about direction as much as level. Core PCE at 2.7% and falling is completely different from Core PCE at 2.7% and rising. The first is progress toward target. The second is re-acceleration. Same number, opposite implications.
Now I always ask: which way is this moving? That single question has improved my inflation reads dramatically.
Forgetting the Lags
Inflation has momentum. Upstream leads downstream by 6-12 months. Policy affects inflation with “long and variable lags” the Fed’s own words. But I’d see commodity prices fall and expect CPI to follow immediately. It doesn’t work that way.
In 2022 shipping costs collapsed. Commodity prices peaked mid-2022. But core inflation didn’t peak until much later, and services kept rising into 2023. The pipeline takes time to clear.
Patience is required. If upstream is falling and downstream is still elevated, that’s not a contradiction. The clearing is coming. Don’t panic out of positions because the headline hasn’t moved yet.
Over-Reacting to Single Prints
One hot CPI doesn’t make Stagflation. One soft print doesn’t mean Goldilocks. Economic data is noisy. Seasonal adjustments are imperfect. There’s genuine randomness in any single reading.
I used to flip my view every month based on whether the number beat or missed. The framework uses 3-month trends for a reason. If your model changes regime on every data release, it’s just a glorified newsfeed.
The short version: Use CPI for confirmation, not initiation. Focus on services, not goods. Track trends, not just levels. Respect the lags. And don’t flip your view on every print.
Applying the Framework
The power of the pipeline model is pattern recognition. Let me walk through how it works in practice, not to tell you what I’m watching specifically, but to show how the framework generates signals.
When the pipeline is clearing: Upstream stable or falling, midstream anchored, downstream decelerating. This is the pattern that precedes disinflationary environments.
When pressure is building: Upstream rising, midstream starting to drift higher, downstream not yet responding. The lead times tell you the downstream move is coming.
When there’s a credibility problem: Midstream de-anchoring even while upstream is stable. This is the Fed’s nightmare, expectations becoming disengaged from fundamentals.
When you need patience: Upstream falling but downstream still sticky. This is normal lag. The clearing is coming, don’t panic out of positions because the headline hasn’t moved yet.
The specific numbers matter less than the pattern. Once you internalise the pipeline structure, you start seeing these combinations everywhere and you start recognising regime shifts before the consensus catches on.
Building Your Own Inflation Framework
Same principle as the growth framework: I’m not going to hand you the exact recipe. The structure matters more than the specific ingredients. Here’s how I’d approach it if I were starting over:
Build the pipeline structure. Separate upstream (leading), midstream (expectations), and downstream (sticky/target). This is the architecture that makes everything else work.
Choose indicators for each stage. You need at least one commodity measure, one shipping/supply chain measure, one market-based expectation measure, one survey-based expectation measure, and two or three downstream measures including something that captures sticky services inflation and wage dynamics.
Weight toward downstream. That’s what the Fed targets and what drives policy. Upstream and midstream get less weight but provide the lead time. I use roughly 20/25/55 but you can adjust based on what works for your style.
Track levels AND trends. For each indicator, you want to know both where it is and which direction it’s moving. A simple 3-month vs 12-month moving average comparison works. Above and rising = accelerating. Below and falling = decelerating.
Set your signposts. What thresholds would trigger a reassessment? Core inflation above a certain level? Long-term expectations drifting higher? Services inflation breaking below target? Write them down before you need them so you’re not moving goalposts when the data gets inconvenient.
Connect to the regime matrix. Inflation alone doesn’t tell you the playbook. You need to combine it with your growth read. Same inflation number means different things depending on whether growth is positive, neutral or negative.
The Bottom Line
Inflation analysis isn’t about predicting the next CPI print. It’s about understanding where pressures are in the system and whether they’re building or clearing.
The pipeline model gives you that edge. Upstream tells you what’s coming. Midstream tells you whether expectations are anchored. Downstream tells you where you actually are. Together, they give you a complete picture and lead time over the reactive approach of just watching the headline number.
Right now, the pipeline is clearing. That’s the framework doing its job and identifying the regime shift before the headlines confirmed it. The Stagflation call from a few weeks ago was real, but the data improved. The inflation pillar moved from +1 to 0. The regime matrix shifted accordingly.
Next time we’ll cover Policy, the third pillar. How to read the Fed beyond the headlines, what real rates actually tell you, why the curve shape matters more than the level, and the distinction between monetary and fiscal that most people miss. Until then, start building your inflation pipeline.
Questions or feedback? macroanalytix.research@gmail.com
Disclaimer:
All content published by MacroAnalytix is for research and educational purposes only. Nothing on this site or in our publications should be interpreted as financial advice, investment recommendations, or a solicitation to buy or sell securities. You are solely responsible for your own financial decisions. Please conduct your own due diligence and consult with a licensed financial professional before making any investment decisions.