

Executive Summary: The 2026 Resource Trap
We’re witnessing the collision of two supercycles and it’s creating an inflationary floor that Jerome Powell can’t cut through no matter how many times he says “data dependent” at a press conference.
The Convergence:
The AI infrastructure buildout has ignited the most synchronized commodity squeeze since the 1970s. Copper prices hit $13,310/ton in January (an all-time high) while gold simultaneously breached $5,000/oz. That shouldn’t happen. These metals typically move in opposition like divorced parents at a graduation ceremony. When both rally together, it signals something structural and I think we’re at a crossroads in the regime change.
The New “Stagflation” Floor:
The Fed cut rates 175 basis points since September 2024, bringing the fed funds rate to 3.50-3.75%. Yet inflation remains sticky at 2.4% CPI (January 2026, down only marginally from 2.7% in December) and the Committee held at the January FOMC meeting with a 10-2 vote. Why? Because the inflation they’re fighting is supply-constrained. You can’t print copper mines. You can’t jawbone kilowatt-hours into existence. Every dollar of AI capex is pulling forward resource demand that the physical world simply cannot supply in 2026.
Regime Scorecard Impact:
This resource bottleneck is shifting our Growth and Inflation pillars toward a “Reflation” or “Late Cycle” bias:
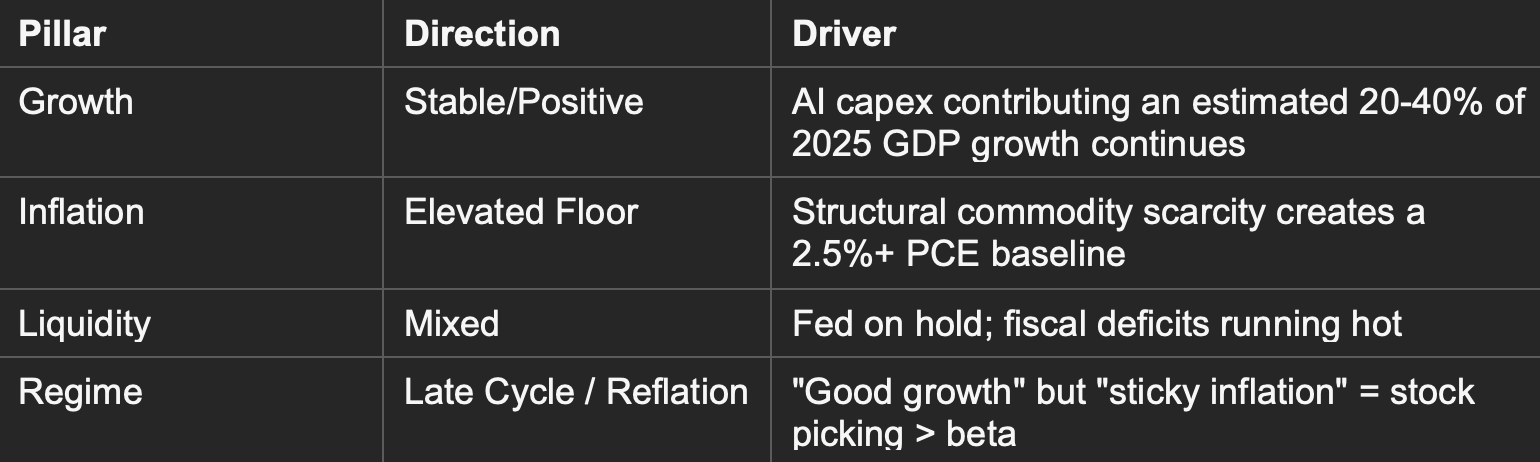
The macro setup for Q1 2026: We have an economy running at 2.3% projected GDP growth, but the inputs required to sustain it are increasingly scarce and expensive. This isn’t 2023’s “transitory” inflation. This is a structural repricing of the physical economy and nobody building an AI model bothered to check if we had enough copper first.
The AI Revolution: Infinite Compute vs. A Finite Grid
The AI revolution has an inconvenient truth that Sam Altman forgot to mention during his congressional testimony: you can’t run inference on hope, vibes, and Series C funding. You need electrons and lots of them, around the clock, without fail.
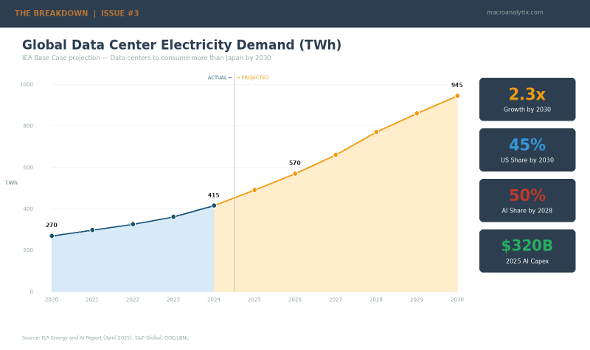
Data Center Power Surge
The numbers are staggering. According to the IEA’s April 2025 “Energy and AI” report, global data center electricity consumption will more than double to 945 TWh by 2030. This is the equivalent of Japan’s entire current electricity demand. The US is ground zero:
• US data center demand hit 183 TWh in 2024 (over 4% of total US electricity consumption).
• Projected to grow 133% to 426 TWh by 2030.
• Data centers will drive almost half of US electricity demand growth through 2030.
• By 2030, the US economy will consume more electricity processing data than manufacturing all energy-intensive goods combined (aluminum, steel, cement, chemicals).
Read that last bullet again. We’re going to use more power asking ChatGPT to write emails than we use making actual physical things. The future is now and it’s extremely energy intensive.
S&P Global projects US data center grid-power demand reaching 75.8 GW in 2026, expanding to 134.4 GW by 2030 which is a near tripling from current levels. Nothing says “AI supremacy” like running trillion-parameter models on infrastructure your grandparents built.
The Primary Bottleneck Has Shifted
For the past three years, the constraint on AI deployment was semiconductor availability, specifically, Nvidia GPUs. Jensen Huang’s leather jacket was the most important garment in global finance. That’s no longer the binding constraint. The new bottleneck is energy.
Consider the math: A modern AI data center requires up to 3x more copper than a traditional server farm for power distribution and cooling. Training runs for frontier models consume megawatts continuously for months. Inference demand scales exponentially with adoption. The physical infrastructure simply cannot keep pace with the code.
Goldman Sachs estimates that AI will drive a 165% increase in data center power demand by 2030. Occupancy rates are projected to peak above 95% in late 2026 before new facilities come online. That’s a chokepoint and chokepoints get repriced.
The “Sustainable Digital Infrastructure” Asset Class
This constraint is spawning an entirely new investment category. Big Tech has committed over $10 billion to nuclear power deals in the past year alone:
• Microsoft: 20-year, $16B PPA with Constellation Energy to restart Three Mile Island (835 MW, targeting 2028).
• Google: First corporate SMR fleet deal with Kairos Power (500 MW pipeline, first reactor by 2030).
• Amazon: $20B+ converting Susquehanna nuclear site into an AI data center campus, plus 1,920 MW supply agreement with Talen Energy through 2042.
• Meta: Issued RFP for 1-4 GW of new nuclear generation; signed 20-year deals for 2.1+ GW from Vistra’s Ohio reactors.
The pattern is unmistakable: hyperscalers are integrating into energy production because they cannot rely on the grid. When Mark Zuckerberg is buying nuclear reactors, we’ve entered a different era of capitalism.
Deloitte projects nuclear could meet up to 10% of data center electricity demand by 2035 but these projects won’t connect to the grid until the 2030s. The 2026-2029 period will be served by natural gas “bridge” solutions which is inflationary and creates the very carbon emissions these companies claim to be avoiding in their glossy sustainability reports.
The irony writes itself. “We’re carbon neutral*” (*if you don’t count the natural gas plants we’re running 24/7 to train GPT-6).
Copper: The “Red Gold” of the AI Era
If gold is the metal of fear, copper is the metal of ambition. And right now the world is long both, which tells you everything about the current macro regime.
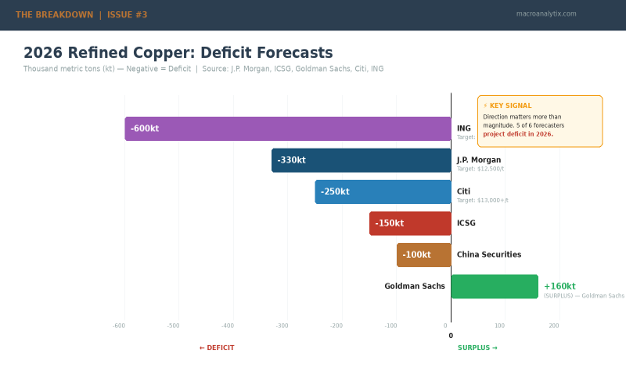
The 2026 Deficit
The International Copper Study Group (ICSG) marked a structural turning point in October 2025, after years of modest surpluses, the refined copper market is swinging to a 150,000-ton deficit in 2026. J.P. Morgan is more aggressive, projecting a ~330,000-ton refined copper deficit. ING sees 600,000 tons.
The variance matters less than the direction. The analysts can argue about how short we are; the point is we’re short.
What’s driving the squeeze:
• Mine supply growth collapsing: ICSG expects just 1.4% mine growth in 2025, down from earlier 2.3% estimates. 2026 refined output growth slows to 0.9%
• Serial disruptions: Grasberg (Indonesia) force majeure, Kamoa-Kakula (DRC) flooding, El Teniente (Chile) accidents. It’s almost like mining is hard and dangerous work that takes decades to develop, who knew?
• Concentrate bottleneck: 2026 benchmark TC/RCs hit $0 in some agreements, smelters are literally paying just to secure feedstock. Zero. The number is zero.
• Structural underinvestment: Fewer than 10 significant copper discoveries in the past decade. Average lead time from discovery to production: 17 years.
The January 2026 S&P Global study put it bluntly: the emerging supply deficit constitutes a “systemic risk for global industries, technological advancement and economic growth.” They project a 10 million metric ton shortfall by 2040. 25% below demand.
Daniel Yergin co-chaired the report: “Here, in short, is the quandary: copper is the great enabler of electrification, but the accelerating pace of electrification is an increasing challenge for copper.”
Translation: The green transition needs copper. AI needs copper. EVs need copper. The grid needs copper. We do not have enough copper.
Strategic Stockpiling & Tariffs: America Discovers Resource Nationalism
The US government has decided copper is a national security issue. On August 1, 2025, President Trump imposed 50% tariffs on semi-finished copper products and copper-intensive derivatives. The free market is apparently only free until we need the stuff.
Key provisions:
• 50% tariff on copper pipes, wires, rods, sheets, tubes (effective August 2025).
• Refined copper (cathodes) currently exempt but a June 30, 2026 review could impose 15% tariffs starting January 2027, rising to 30% in 2028.
• 25% domestic sales requirement for copper input materials starting 2027, increasing to 40% by 2029.
The result: a two-tier market that would make an emerging market currency trader feel right at home. COMEX inventories have soared to over 492,000 metric tons (an all-time high) as traders front-run potential tariffs. Meanwhile, LME stocks fell to ~147,000 tons, down from ~256,000 a year ago.
When America says “critical mineral,” other countries hear “good luck with your energy transition.”
Price Outlook: LME copper hit an all-time high of $13,310/ton in January 2026. J.P. Morgan sees $12,500/ton in H1 2026, potentially higher. Citi’s aggressive target: $13,000+/ton, with a path to $15,000 if supply shortages persist.
The Macro Framework: Tracking the Convergence
The traditional playbook says copper rallies in expansion and gold rallies in contraction. Econ 101 stuff. What happens when both rally simultaneously? We’re finding out in real-time.
The Copper-Gold Ratio: The Signal Is Broken (Or Is It?)
The copper-to-gold ratio (copper price ÷ gold price) is one of the most reliable barometers of industrial confidence vs. safe-haven demand. When the ratio rises, the world believes in growth. When it falls, fear dominates.
Current reading: The ratio has collapsed to historic lows, levels not seen since 1990. Gold has surged 65%+ in 2025 to over $4,600/oz, with J.P. Morgan forecasting $5,055/oz by Q4 2026. Meanwhile, copper is also at record highs.
The explanation: Both metals are responding to the same structural force, monetary debasement and resource scarcity, rather than opposite forces (growth optimism vs. recessionary fear). They’re not disagreeing about the economy.
The “K-Shaped” Productivity Gap
AI-driven productivity gains exist, but they’re concentrated. The tech sector is seeing measurable efficiency improvements from large language models. But these gains accrue disproportionately to high-income, knowledge-work sectors, the people least likely to struggle with 3% inflation in the first place.
Meanwhile, the industries buckling under commodity inflation are labor-intensive, physical-world businesses: construction, transportation, manufacturing. They can’t substitute away from copper wire, diesel fuel or steel beams. No amount of ChatGPT is going to reduce the copper content in a transformer.
The result is a “K-shaped” productivity divergence:
• Upper branch: AI adopters seeing margin expansion, labor efficiency, competitive moats.
• Lower branch: Traditional industries facing input cost inflation without offsetting productivity gains.
The average is fine but the median is not.
The Global Dimension: This Is Not Just an American Problem
China accounts for 58% of global refined copper consumption and its post-Lunar New Year restocking cycle will be the first real demand test of 2026. Early signals suggest fabricators are buying dips, state-backed industry groups have urged Beijing to increase strategic copper reserves. Meanwhile, Europe faces its own grid constraints: the EU’s Carbon Border Adjustment Mechanism enters full implementation in 2026, adding cost pressure to carbon-intensive metal imports. Germany’s data center electricity consumption alone is forecast to reach 31 TWh. The bottleneck is global. Who is going to pay for it first.
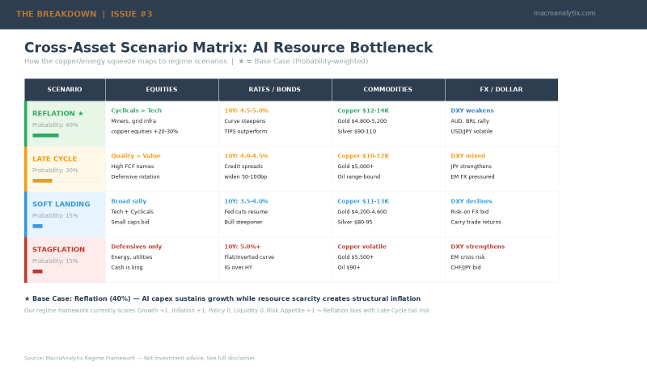
Cross-Asset Implications & Scenario Updates
Equities: Rotation to “Physical Enablers”
The 2025 trade was “Pure Play” AI, Nvidia, Microsoft, the hyperscalers, AI software names. That trade worked spectacularly. Anyone who bought NVDA in January 2025 can afford to read this newsletter from a yacht. But 2026 favors a rotation toward “Physical Enablers”, during the gold rush, sell shovels could ring true again.
Sector preferences:
• Copper miners: Freeport-McMoRan, Southern Copper, Ivanhoe Mines - direct exposure to structural deficit.
• Nuclear operators: Constellation Energy, Talen Energy, Dominion Energy - 20-year PPA visibility.
• Grid infrastructure: Quanta Services, MasTec, AECOM - transmission buildout beneficiaries.
• Uranium: Cameco, Kazatomprom - nuclear fuel chain as hyperscalers commit to 10+ GW.
The risk: These are cyclical names trading at cyclical multiples. If a recession materializes (which would kill AI capex), they’d fall hard.
Rates: Higher-for-Longer Until Something Breaks
The Fed held at 3.50-3.75% in January with two dissents calling for cuts. Chair Powell noted rates are “not significantly restrictive right now.” J.P. Morgan expects the Fed to remain on hold through 2026.
The constraint: “Energy-driven” inflation creates a floor under rates. The Fed cannot cut aggressively while commodity prices are at records and tariffs are creating input cost pressures. Their December 2025 SEP projected core PCE at 2.5% by year-end 2026, above target.
Powell can’t say “we’re stuck” out loud, but 2.5% core PCE with rates at 3.5% is the definition of stuck.
Commodities: The Bid Is Structural, Not Speculative
• Copper: $11,000-$13,000/ton trading range, with upside to $15,000 if tariff reviews tighten supply further
• Gold: Already at all-time highs above $4,600/oz. J.P. Morgan sees $5,055 by Q4 2026
• Silver: The sleeper. Touched ~$113/oz in January’s speculative blow-off (from ~$40 in late 2024). Currently trading ~$78-82/oz after the correction. Goldman targets $85-$100 average in 2026; Citi sees $110 in H2 if industrial demand holds
The overall commodity thesis: This is not a speculative bubble driven by easy money and leverage. It’s a structural repricing driven by supply constraints meeting electrification demand. The demand is not discretionary, you cannot deploy AI without copper, without grid capacity, without energy.
The trade isn’t “commodities are cheap.” The trade is “commodities are necessary, and we don’t have enough of them.”
Conclusion: Sizing for the Physical Tail Risk
We’re positioned for a world where “compute demand exceeds supply”—not just semiconductor supply, but energy supply, copper supply, grid capacity. This creates an inflationary floor that the Fed cannot cut through without engineering a recession that destroys the AI buildout itself.
The policy trilemma is real: The US wants AI supremacy, price stability and cheap money. Pick two.
The March FOMC Preview
The March 17-18 FOMC meeting is the next major catalyst. The question for the Fed: Will they acknowledge the structural inflation risks from the infrastructure buildout? Or will they continue modeling AI capex as “normal” business investment?
The Fed’s framework assumes rate hikes cool demand, which cools inflation. It’s a demand-side model for a supply-side problem. When inflation is supply-constrained, when the bottleneck is copper mines in Chile, uranium enrichment capacity or grid interconnection queues, rate hikes just destroy the demand side without addressing supply. They can engineer a recession but they cannot engineer a copper mine.
Either way, the resource trap is real. Silicon Valley built the future without checking if we had the raw materials to ship it. Now the invoice is arriving.
Questions or feedback? macroanalytix.research@gmail.com
Disclaimer
All content published by MacroAnalytix is for research and educational purposes only. Nothing on this site or in our publications should be interpreted as financial advice, investment recommendations, or a solicitation to buy or sell securities. You are solely responsible for your own financial decisions. Please conduct your own due diligence and consult with a licensed financial professional before making any investment decisions.